Original Link: https://www.anandtech.com/show/6533/gigabyte-ga7pesh1-review-a-dual-processor-motherboard-through-a-scientists-eyes
Gigabyte GA-7PESH1 Review: A Dual Processor Motherboard through a Scientist’s Eyes
by Ian Cutress on January 5, 2013 10:00 AM EST- Posted in
- Gigabyte
- Motherboards
- C602
Browsing through a manufacturer’s website can offer a startling view of the product line up. Such was the case when I sprawled through Gigabyte’s range, only to find that they offer server line products, including dual processor motherboards. These are typically sold in a B2B environment (to system builders and integrators) rather than to the public, but after a couple of emails they were happy to send over their GA-7PESH1 model and a couple of Xeon CPUs for testing. Coming from a background where we used dual processor systems for some serious CPU Workstation throughput, it was interesting to see how the Sandy Bridge-E Xeons compared to consumer grade hardware for getting the job done.
In my recent academic career as a computational chemist, we developed our own code to solve issues of diffusion and migration. This started with implicit grid solvers – everyone in the research group (coming from chemistry backgrounds rather than computer science backgrounds), as part of their training, wrote their own grid and solver classes in C++ which would be the backbone of the results obtained in their doctorate degree. Due to the idiosyncratic nature of coders and learning how to code, some of the students naturally wrote classes were easily multi-threaded at a high level, whereas some used a large amount of localized cache which made multithreading impractical. Nevertheless, single threaded performance was a major part in being able to obtain the results of the simulations which could last from seconds to weeks. As part of my role in the group, I introduced the chemists to OpenMP which sped up some of their simulations, but as a result caused the shift in writing this code towards the multithreaded. I orchestrated the purchasing of dual processor (DP) Nehalem workstations from Dell (the preferred source of IT equipment for the academic institution (despite my openness to build in-house custom hardware) in order to speed up the newly multithreaded code (with ECC memory for safety), and then embarked on my own research which looked at off-the-shelf FEM solvers then explicit calculations to parallelize the code at a low level, which took me to GPUs, which resulted in nine first author research papers overall in those three years.
In a lot of the simulations written during that period by the multiple researchers, one element was consistent – trying to use as much processor power as possible. When one of us needed more horsepower for a larger number of simulations, we used each other’s machines to get the job done quicker. Thus when it came to purchasing those DP machines, I explored the SR-2 route and the possibility of self-building the machines, but this was quickly shot down by the IT department who preferred pre-built machines with a warranty. In the end we purchased three dual E5520 systems, to give each machine 8 cores / 16 threads of processing power, as well as some ECC memory (thankfully the nature of the simulations required no more than a few megabytes each), to fit into the budget. When I left that position, these machines were still going strong, with one colleague using all three to correlate the theoretical predictions with experimental results.
Since leaving that position and working for AnandTech, I still partake in exploring other avenues where my research could go into, albeit in my spare time without funding. Thankfully moving to a single OCed Sandy Bridge-E processor let me keep the high level CPU code comparable to during the research group, even if I don’t have the ECC memory. The GPU code is also faster, moving from a GTX480 during research to 580/680s now. One of the benchmarks in my motherboard reviews is derived from one of my research papers – regular readers of our motherboard reviews will recognize the 3DPM benchmark from those reviews and in the review today, just to see how far computation has gone. Being a chemist rather than a computer scientist, the code for this benchmark could be comparable to similar non-CompSci trained individuals – from a complexity point of view it is very basic, slightly optimized to perform faster calculations (FMA) but not the best it could be in terms of full blown SSE/SSE2/AVX extensions et al.
With the vast number of possible uses for high performance systems, it would be impossible for me to cover them all. Johan de Gelas, our server reviewer, lives and breathes this type of technology, and hence his benchmark suite deals more with virtualization, VMs and database accessing. As my perspective is usually from performance and utility, the review of this motherboard will be based around my history and perspective. As I mentioned previously, this product is primarily B2B (business to business) rather than B2C (business to consumer), however from a home build standpoint, it offers an alternative to the two main Sandy Bridge-E based Xeon home-build workstation products in the market – the ASUS Z9PE-D8 WS and the EVGA SR-X. Hopefully we will get these other products in as comparison points for you.
Visual Inspection
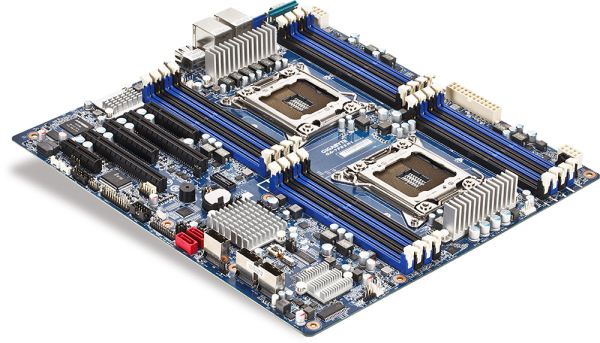
I knew server boards were large, but coming from the ATX and E-ATX standards, this thing is huge. It measures 330mm x 305mm (13” x 12”) which correlates to the SSI EEB specification for server motherboards. This is the size exact size of an official E-ATX motherboard (despite a small amount of loose definition), but to put the icing on the cake, the mounting holes for the motherboard are different to the normal ATX standards. If we took a large case, like the Rosewill Blackhawk-Ultra, it supports ATX, SSI CEB, XL-ATX, E-ATX and HPTX, up to 13.6” x 15”, but not SSI EEB. Thus drilling extra holes for standoffs may be required.
Unlike the SR-X or Z9PE-D8 WS, the GA-7PESH1 supports two memory modules per channel for all channels on board. In terms of specifications this means support for up to 128 GB UDIMM (i.e. regular DDR3), 128 GB UDIMM ECC, and 512 GB RDIMM ECC. Due to the nature of the design, only 1066-1600 MHz is supported, but the GA-7PESH1 supports 1600 MHz when all slots are populated. For our testing, Kingston has kindly supplied us with 8x4GB of their 1600 C11 ECC memory.
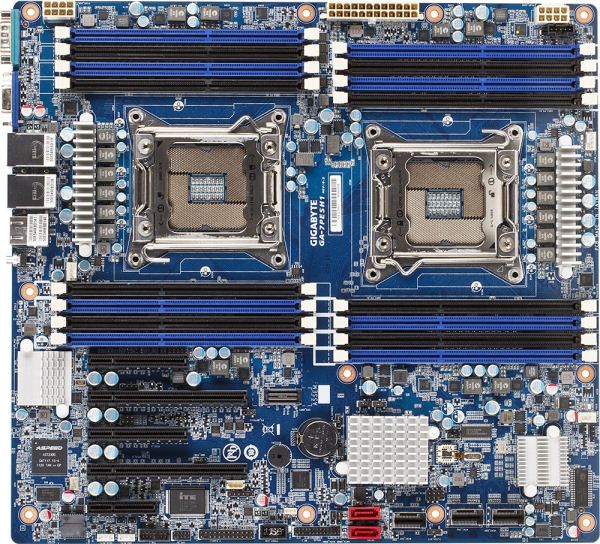
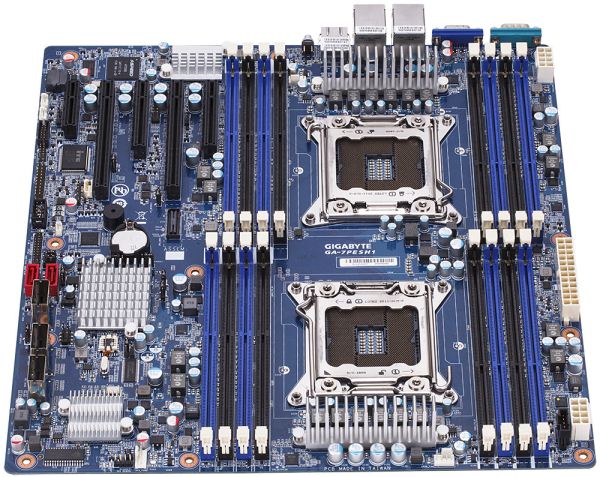
As with the majority of server boards, stability and longevity is a top priority. This means no overclocking, and Gigabyte can safely place a six phase power delivery on each CPU – it also helps that all SB-E Xeons are multiplier locked and there is no word of unlocked CPUs being released any time soon. As we look at the board, standards dictate that the CPU on the right is designated as the first CPU. Each CPU has access to a single fan header, and specifications for coolers are fairly loose in both the x and the y directions, limited only by memory population and the max z-height of the case or chassis the board is being placed into. As with all dual CPU motherboards, each CPU needs its own Power Connector, and we find them at the top of the board behind the memory slots and at opposite ends. The placement of these power connectors is actually quite far away for a normal motherboard, but it seems that the priority of the placement is at the edge of the board. In between the two CPU power connectors is a standard 24-pin ATX power connector.
One of the main differences I note coming from a consumer motherboard orientation is the sheer number of available connectors and headers on such a server motherboard. For example, the SATA ports have to be enabled by moving the jumpers the other side of the chipset. The chipset heatsink is small and basic – there is no need for a large heatsink as the general placement for such a board would be in a server environment where noise is not particularly an issue if there are plenty of Delta fans to help airflow.
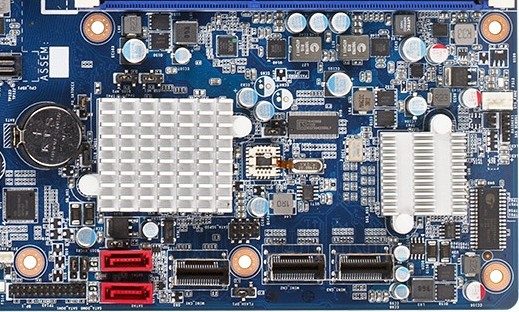
On the bottom right of the board we get a pair of SATA ports and three mini-SAS connections. These are all perpendicular to the board, but are actually in the way of a second GPU being installed in a ‘normal’ motherboard way. Users wishing to use the second PCIe x8 slot on board may look into PCIe risers to avoid this situation. The heatsink on the right of this image covers up an LSI RAID chip, allowing the mSAS drives to be hardware RAIDed.
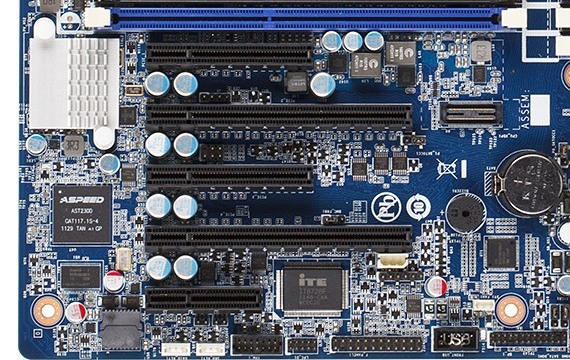
As per normal operation on a C602 DP board, the PCIe slots are taken from the PEG of one CPU. On some other boards, it is possible to interweave all the PCIe lanes from both CPUs, but it becomes difficult when organizing communication between the GPUs on different CPUs. From top to bottom we get an x8 (@x4), x16, x8 (@x4), x16 (@x8), x4(@x1). It seems odd to offer these longer slots at lower speed ratings, but all of the slots are Gen 3.0 capable except the x4(@x1). The lanes may have been held back to maintain data coherency.
To those unfamiliar with server boards, of note is the connector just to the right of center of the picture above. This is the equivalent of the front panel connection on an ATX motherboard. At almost double the width it has a lot more options, and where to put your cables is not printed on the PCB – like in the old days we get the manual out to see what is what.
On the far left we have an ASPEED AST2300 chip, which has multiple functions. On one hand it is an onboard 2D graphics chip which powers the VGA port via its ARM926EJ (ARM9) core at 400 MHz. For the other, it as an advanced PCIe graphics and remote management processor, supporting dual NICs, two COM ports, monitoring functions and embedded memory. Further round this section gives us a removable BIOS chip, a COM header, diagnostic headers for internal functions, and a USB 2.0 header.

The rear IO is very bare compared to what we are normally used to. From left to right is a serial port, the VGA port, two gigabit Ethernet NICs (Intel I350), four USB 2.0 ports, the KVM server management port, and an ID Switch button for unit identification. There is no audio here, no power/reset buttons, and no two-digit debug LED. It made for some rather entertaining/hair removing scenarios when things did not go smoothly during testing.
Board Features
| Gigabyte GA-7PESH1 | |
| Price |
Contact: 17358 Railroad St. City of Industry CA 91748 +1-626-854-9338 |
| Size | SSI EEB |
| CPU Interface | LGA 2011 |
| Chipset | Intel C602 |
| Memory Slots |
Sixteen DDR3 DIMM slots supporting: 128GB (UDIMM) @ 1.5V 512GB (RDIMM) @ 1.5V 128GB DDR3L @ 1.35 V Quad Channel Arcitecture ECC RDIMM for 800-1600 MHz Non-ECC UDIMM for 800-1600 MHz |
| Video Outputs | VGA via ASPEED 2300 |
| Onboard LAN | 2 x Intel I350 supporting uo to 1000 Mbps |
| Onboard Audio | None |
| Expansion Slots |
1 x PCIe 3.0 x16 1 x PCIe 3.0 x16 (@ x8) 2 x PCIe 3.0 x8 (@ x4) 1 x PCIe 2.0 x4 (@ x1) |
| Onboard SATA/RAID |
2 x SATA 6 Gbps, Supporting RAID 0,1 2 x mini-SAS 6 Gbps, Supporting RAID 0,1 1 x mini-SAS 3 Gbps, Supporting RAID 0,1 |
| USB | 6 x USB 2.0 (Chipset) [4 back panel, 2 onboard] |
| Onboard |
2 x SATA 6 Gbps 2 x mSAS 6 Gbps 1 x mSAS 3 Gbps 1 x USB 2.0 Header 4 x Fan Headers 1 x PSMI header 1 x TPM header 1 x SKU KEY header |
| Power Connectors |
1 x 24-pin ATX Power Connector 2 x 8-pin CPU Power Connector |
| Fan Headers |
2 x CPU (4-pin) 2 x SYS (4-pin, 3-pin) |
| IO Panel |
1 x Serial Port 1 x VGA 2 x Intel I350 NIC 4 x USB 2.0 1 x KVM NIC 1 x ID Switch |
| Warranty Period | Refer to Sales |
| Product Page | Link |
Without having a direct competitor to this board on hand there is little we can compare such a motherboard to. In this level having server grade Intel NICs should be standard, and this board can take 8GB non-ECC memory sticks or 32GB ECC memory sticks, for a maximum of 512 GB. If your matrix solvers are yearning for memory, then this motherboard can support it.
Gigabyte GA-7PESH1 BIOS
As the server team at Gigabyte is essentially a different company to the consumer motherboard team, there is little cross talk and parity between the two. When the consumer motherboard side used the C606 server chipset for the Gigabyte X79S-UP5, the whole package got the consumer motherboard BIOS, software and utilities. With this C602 enabled GA-7PESH1, utilities such as the BIOS and software are designed in the server department and are not as well designed as their consumer counterparts.
In terms of the BIOS, this means we get a reskinned Aptio Setup Utility from American Megatrends, rather than the 3D BIOS implementation. Aesthetically the BIOS is prehistoric in terms of recent trends, but the server based platform has a lot more to deal with – having just a list of options make it very easy to add/subtract functionality as required.
Updating the BIOS is a hassle from the off – there is no update feature in the BIOS itself, and the utilities provided by Gigabyte are limited to DOS bootable USB sticks only. This means sourcing a DOS bootable USB stick in order to put the software onboard. There are a few utilities online that will streamline this process, but due to some memory issues I initially had with the motherboard, thankfully Gigabyte talked me through the exact procedure.
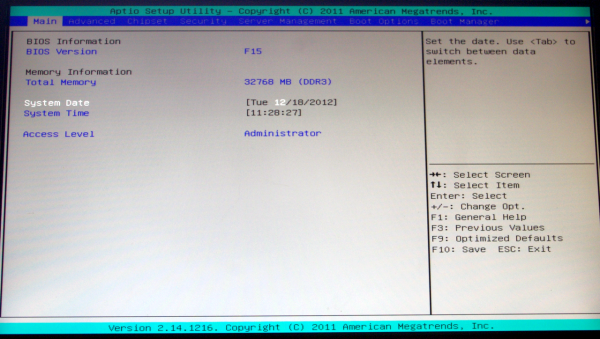
The front screen of the BIOS is basic at best, telling us the BIOS version, the total memory installed and the system date. Despite the market orientation for such a product, some indication as to what the motherboard is and the CPUs that are installed, at the bare minimum, would have been nice.
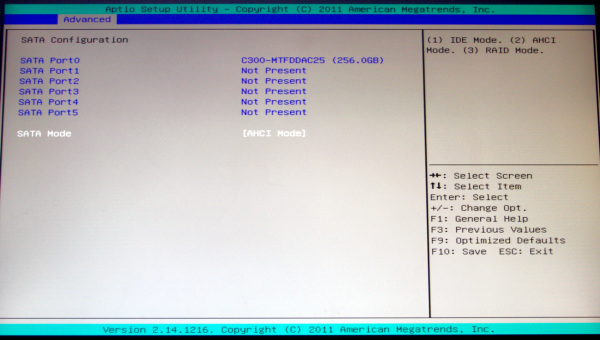
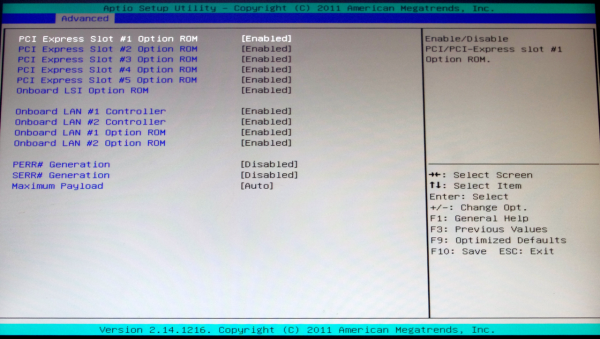
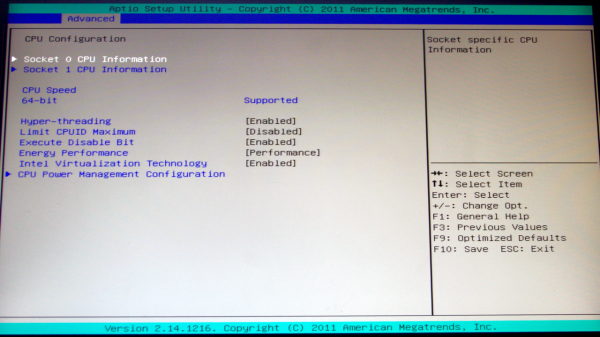
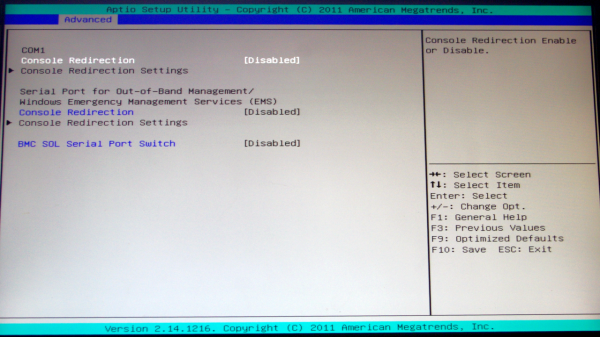
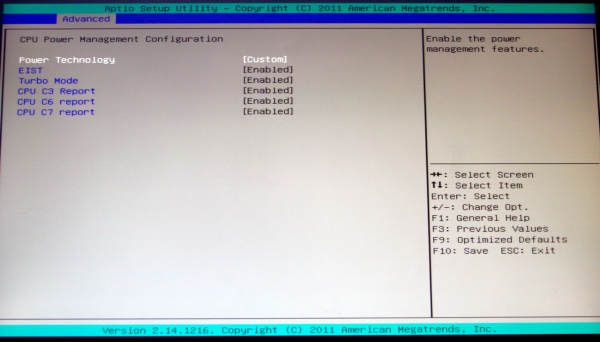
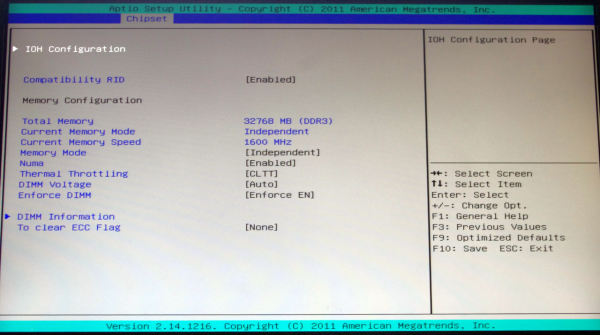
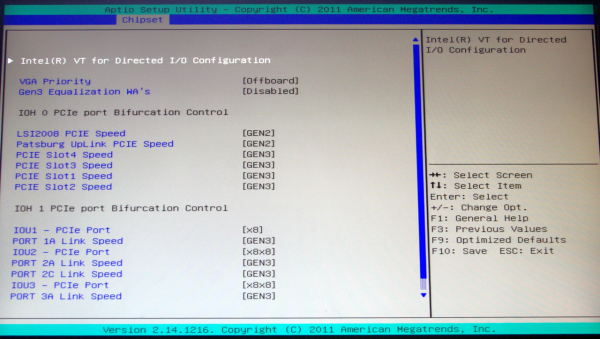
Apologies for the quality of the BIOS images – the BIOS has no ‘Print Screen to USB’ utility, and thus these images are taken with my DSLR in less-than-ideal lighting conditions.
The Advanced menu tab has options relating to PCI Configuration, Trusted Computing (TPM), CPU identification and configuration (such as Hyperthreading and Power Management), error logging, SATA configuration, Super IO configuration and Serial Port options.
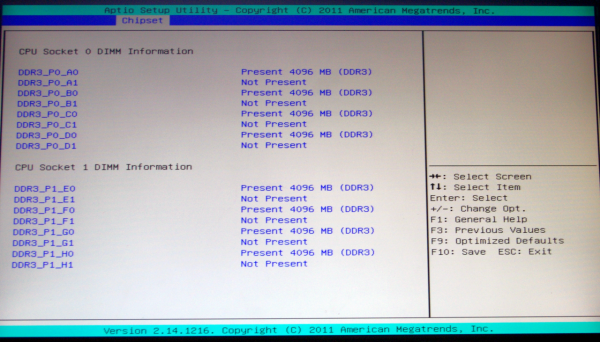
The Chipset tab option gives us access to North Bridge/South Bridge options, such as the memory controller, VT-d, PCIe lane counts and memory detection.
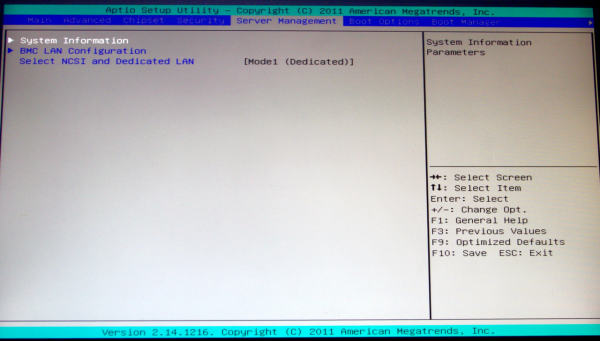
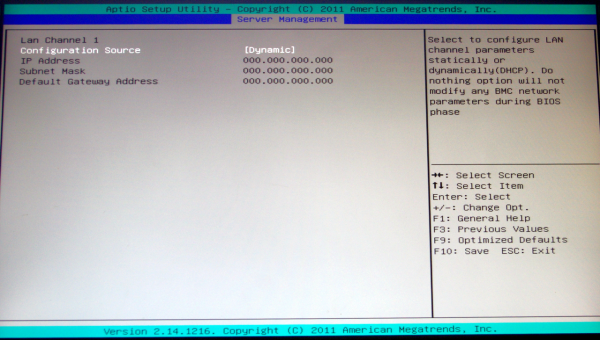
In order to access the server management features, after an ethernet cable has been plugged into the server management port, the IP for login details can be found in the server management tab:
Other options in the BIOS are for boot priority and boot override.
Gigabyte GA-7PESH1 Software
Typically when a system integrator buys a server motherboard from Gigabyte, a full retail package comes with it including manuals, utility CDs and SATA cables. Gigabyte have told me that this will be improved in the future, with SAS cables, header accessories and GPU bridges for CF/SLI. But due to the nature of my review sample, there was no retail package as such. When I received a sample from Gigabyte, there was no retail box with extras, nor were there driver CDs or a user guide and manual. Good job then that all these can be found on the Gigabyte website under the download section for the GA-7PESH1. In my case, this involves downloading the Intel .inf files, the ASPEED 2300 drivers, and the Intel LAN drivers. Also available on the website are the LSI SAS RAID drivers, and the SATA RAID driver.
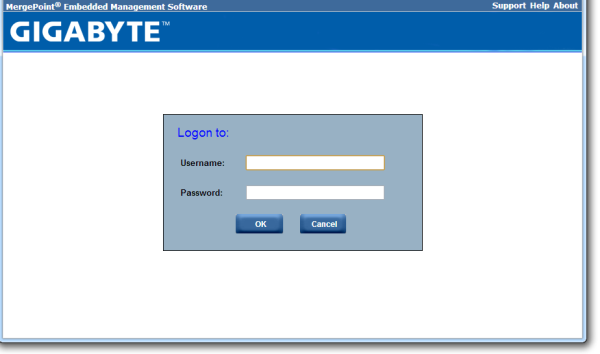
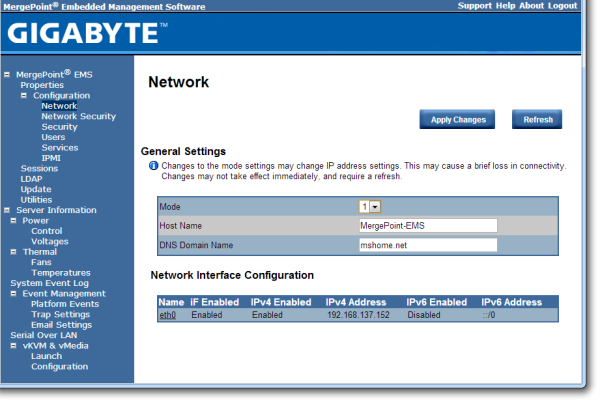
When it comes to software available to download, the river has run dry. There is literally not one piece of software available to the user – nothing relating to monitoring, or fan controls or the like. The only thing that approaches a software tool is the Advocent Server Management Interface, which is accessed via the browser of another computer connected to the same network when the system has the third server management NIC connection activated.
When the system is connected to the power supply, and the power supply is switched on, the motherboard takes around 30 seconds to prepare itself before the power button on the board itself can be pushed. There is a green light physically on the board that turns from a solid light to a flashing light when this button can be pushed - the board then takes another 60 seconds or so to POST. During this intermediate state when the light is flashing, the server management software can be accessed through the web interface.
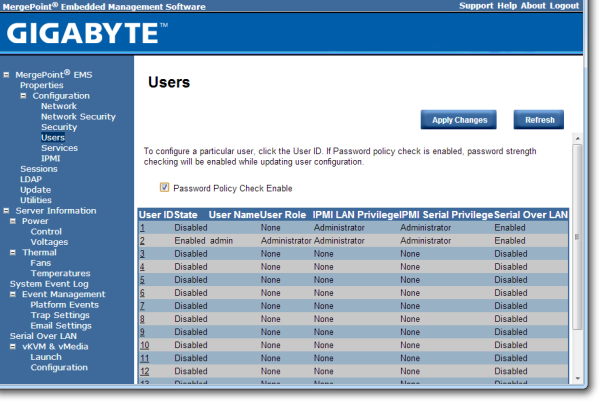
The default username and password are admin and password for this interface, and when logged in we get a series of options relating to the management of the motherboard:
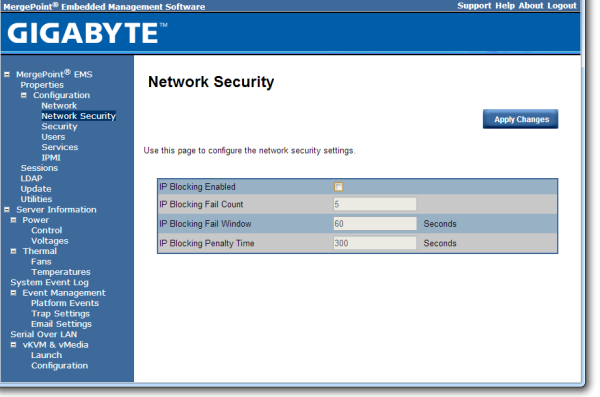
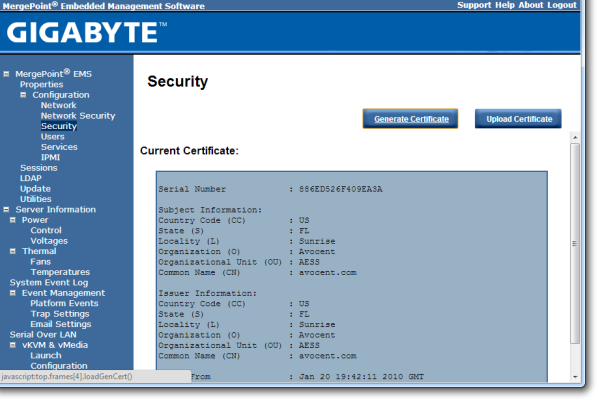
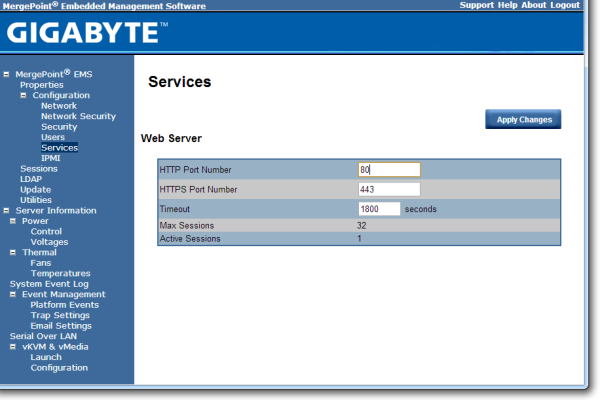
The interface implements a level of security in accessing the management software, as well as keeping track of valid user accounts, web server settings, and active interface sessions.
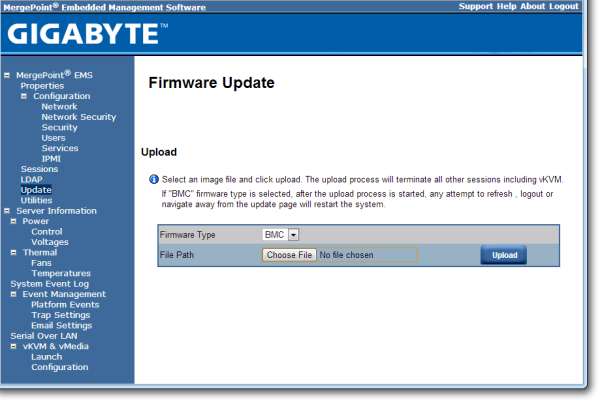
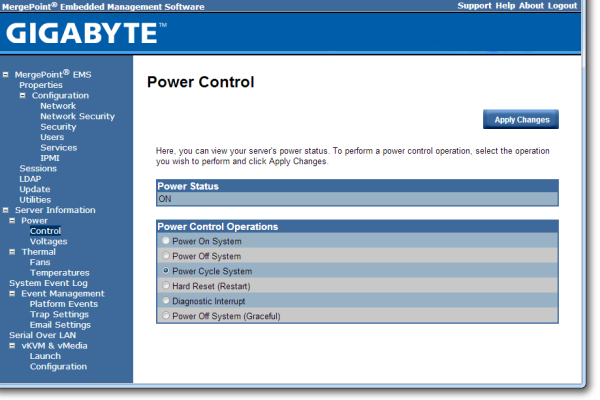
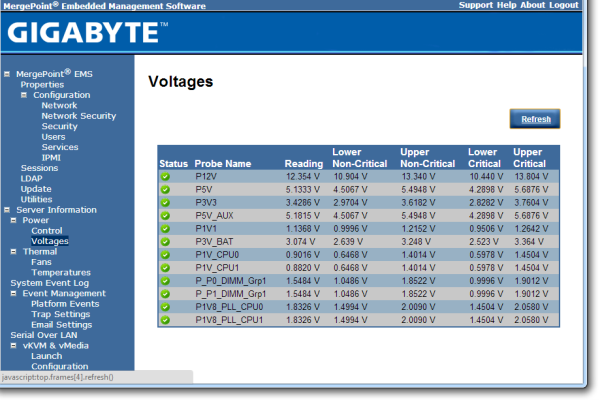
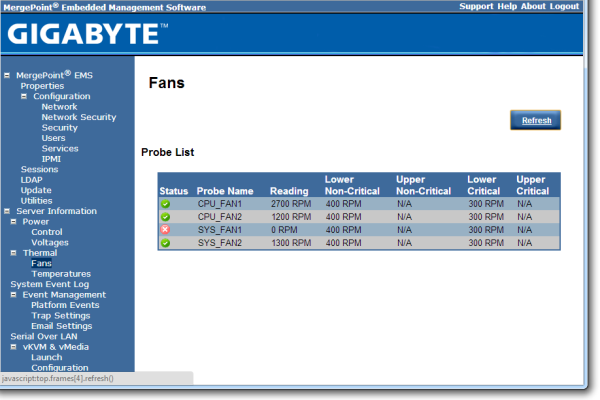
The software also provides options to update the firmware, and to offer full control as to the on/off state of the motherboard with access to all voltages, fan speeds and temperatures the software has access to.
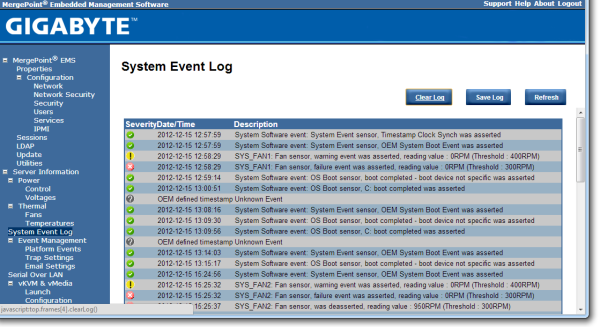
The system log helps identify when sensors are tripped (such as temperature and fans) as well as failed boots and software events.
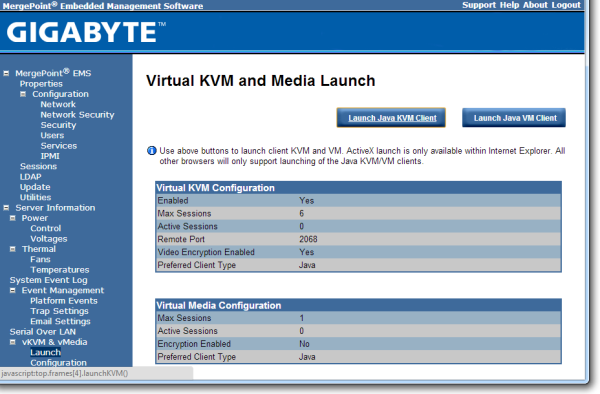
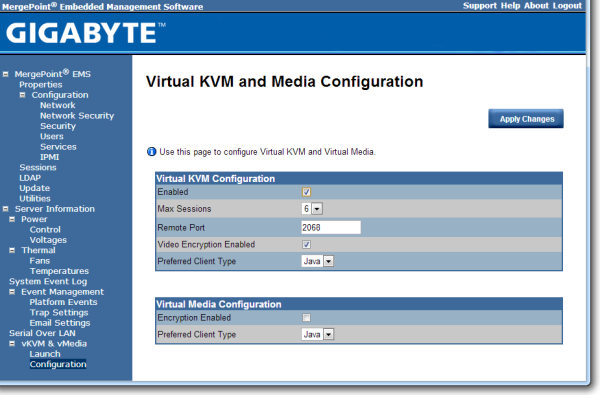
Both Java KVM and Have VM environments are supported, with options relating to these in the corresponding menus.
It should also be noted that during testing, we found the system to be unforgiving when changing discrete GPUs. If an OS was installed while attached to a GTX580 and NVIDIA drivers were installed, the system would not boot if the GTX580 was removed and a HD7970 was put in its place. The same thing happens if the OS is installed under the HD7970 and the AMD drivers installed.
Many thanks to...
We must thank the following companies for kindly donating hardware for our test bed:
OCZ for donating the Power Supply and USB testing SSD
Micron for donating our SATA testing SSD
Kingston for donating our ECC Memory
ASUS for donating AMD GPUs
ECS for donating NVIDIA GPUs
Test Setup
| Test Setup | |
| Processor |
2x Intel Xeon E5-2690 8 Cores, 16 Threads, 2.9 GHz (3.8 GHz Turbo) each |
| Motherboards | Gigabyte GA-7PESH1 |
| Cooling |
Intel AIO Liquid Cooler Corsair H100 |
| Power Supply | OCZ 1250W Gold ZX Series |
| Memory | Kingston 1600 C11 ECC 8x4GB Kit |
| Memory Settings | 1600 C11 |
| Video Cards |
ASUS HD7970 3GB ECS GTX 580 1536MB |
| Video Drivers |
Catalyst 12.3 NVIDIA Drivers 296.10 WHQL |
| Hard Drive | Corsair Force GT 60 GB (CSSD-F60GBGT-BK) |
| Optical Drive | LG GH22NS50 |
| Case | Open Test Bed - DimasTech V2.5 Easy |
| Operating System | Windows 7 64-bit |
| SATA Testing | Micron RealSSD C300 256GB |
| USB 2/3 Testing | OCZ Vertex 3 240GB with SATA->USB Adaptor |
Power Consumption
Power consumption was tested on the system as a whole with a wall meter connected to the OCZ 1250W power supply, with a single 7970 GPU installed. This power supply is Gold rated, and as I am in the UK on a 230-240 V supply, leads to ~75% efficiency > 50W, and 90%+ efficiency at 250W, which is suitable for both idle and multi-GPU loading. This method of power reading allows us to compare the power management of the UEFI and the board to supply components with power under load, and includes typical PSU losses due to efficiency. These are the real world values that consumers may expect from a typical system (minus the monitor) using this motherboard.
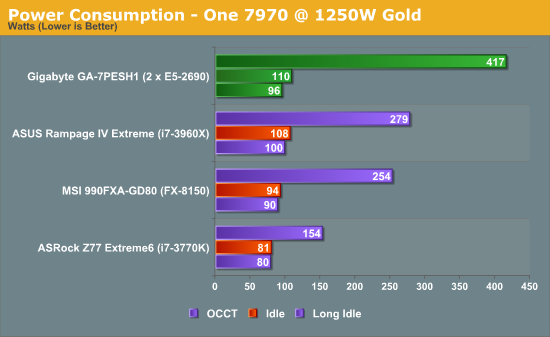
Using two E5-2690 processors would mean a combined TDP of 270W. If we make the broad assumption that the processors combined use 270W under loading, this places the rest of the motherboard at around 110-130W, which is indicated by our idle numbers (despite PSU efficiency).
POST Time
Different motherboards have different POST sequences before an operating system is initialized. A lot of this is dependent on the board itself, and POST boot time is determined by the controllers on board (and the sequence of how those extras are organized). As part of our testing, we are now going to look at the POST Boot Time - this is the time from pressing the ON button on the computer to when Windows starts loading. (We discount Windows loading as it is highly variable given Windows specific features.) These results are subject to human error, so please allow +/- 1 second in these results.
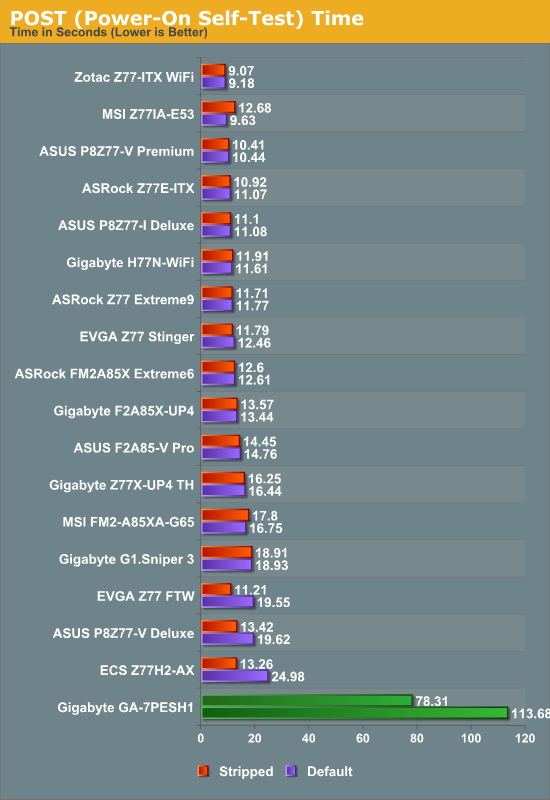
The boot time on this motherboard is a lot longer than anything I have ever experienced. Firstly, when the power supply is switched on, there is a 30 second wait (indicated by a solid green light that turns into a flashing green light) before the motherboard can be switched on. This delay is to enable the management software to be activated. Then, after pressing the power switch, there is around 60 seconds before anything visual comes up on the screen. Due to the use of the Intel NICs, the LSI SAS RAID chips and other functionality, there is another 53 seconds before the OS actually starts loading. This means there is about a 2.5 minute wait from power at the wall enabled to a finished POST screen. Stripping the BIOS by disabling the extra controllers gives a sizeable boost, reducing the POST time by 35 seconds.
Simulations, Memory Requirements and Dual Processors
Throughout my simulation career, it would have been easy enough to just write code, compile and simply watch it run. But the enthusiast and speed freak within me wanted the code to go a little faster, then a little faster, until learning about types of memory and how to prioritize code became part of my standard code scenario. There are multiple issues that all come together from all sides of the equation.
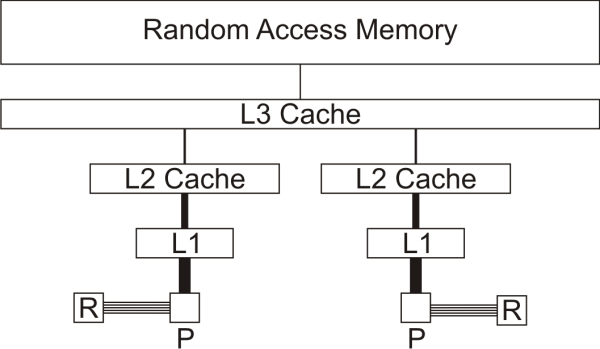
First of all, let us discuss at a high level the concept of memory caching on a pseudo-processor.
The picture above is a loose representation of a dual core processor, with each core represented as ‘P’, Registers labeled as ‘R’, and the size of the lines is representative of the bandwidth.
The processor has access to some registers which are a high-bandwidth, low space memory store. These registers are used to store intermediary calculation data, as well as context switching with HyperThreading. The processor is also directly linked to an L1 (‘level 1’) cache, which is the first place the processor looks if it needs data from memory. If the data is not in the L1 then it looks in the L2 (‘level 2’), and so on until the data is found. Obviously the closer the data is to the processor, the quicker it can be accessed and the calculation should prove to be quicker, and thus there are large benefits to larger caches.
In the diagram above, each processor core has its own L1 cache and L2 cache, but a shared L3 cache. This allows each core to probe the data in L3. What is not shown is that there are some snoop protocols designed to let each core know what is going on in another core’s L2 cache. With data flying around it is most important to maintain cache coherency.
Take an example where we have a simulation running two threads on our imaginary processor, and each thread requires 200 kB of data. If our L2 cache is 256 kB then the thread can easily run inside the L2 keeping data rates high. In the event that each core needs data from the other thread, values are copied into L3 at the expense of time.
Now imagine that our processor supports HyperThreading. This allows us to run two threads on each processor core. We still have the same amount of hardware, but when one thread is performing a memory read or write operation, that creates a delay until the read or write operation is confirmed. While this delay is occurring, the processor core can save the state of the first thread and move on with the second.
The downside to our new HyperThreading scenario is when we launch a program with four threads, and each thread uses 200 kB of memory. If our L2 cache is only 256 kB, then the combined 400 kB of data spills over into our L3 cache. This has the potential of slowing down simulations if read and write operations are very slow. (In modern processors, a lot of the logic built into the processor is designed to move data around such that these memory operations are as quick as possible – it goes ahead and predicts which data is needed next.)
This is the simple case of a dual core processor with HyperThreading. It gets even more complicated if you add in the concept of dual processors.
If we have two dual core processors (four cores total) with HyperThreading (eight threads), the only memory share between the processors is the main random access memory. When a standard program launches multiple threads, there is no say in where those threads will end up – they may be run out-of-order on whatever processor core is available. Thus if one thread needs data from another, several things may occur:
(1) The thread may be delayed until the other thread is processed
(2) The data may already be on the same processor
(3) The data may be on the other processor, which causes delays
There are many different types of simulation that can be performed, each with their own unique way of requesting memory or dealing with threads. As mentioned in the first page of this review, even in the research group I was in, if two people wrote code to perform the same simulation, memory requirements of each could be vastly different. This makes it even more complicated, as when moving into a multithreaded scenario the initially slower simulation might be sped up the most.
Talking About Simulations
The next few pages will talk about a different type of simulation in turn based on my own experiences and what I have coded up. Several are based on finite-difference grid solvers (both explicit and implicit), we have a Brownian test based on six movement algorithms, an n-body simulation, and our usual compression / video editing tests. The ones we have written for this review will be explained briefly both mathematically and in code.
Explicit Finite Difference
For a grid of points or nodes over a simulation space, each point in the space can describe a number of factors relating to the simulation – concentration, electric field, temperature, and so on. In terms of concentration, the material balance gradients are approximated to the differences in the concentrations of surrounding points. Consider the concentration gradient of species C at point x in one dimension, where [C]x describes the concentration of C at x:
 [1]
[1]
The second derivative around point x is determined by combining the half-differences from the adjacent half-points next to x:
 [2]
[2]
Equations [1] and [2] can be applied to the partial differential equation [3] below to reveal a set of linear equations which can be solved.
Fick’s first law for the rate of diffusional mass transport can be applied in three dimensions:
 [3]
[3]
where D is the diffusion coefficient of the chemical species, and t is the time. For the dimensional analyses used in this work, the Laplacian is split over the Cartesian dimensions x, y and z.
Dimension transformations are often employed to these simulations to relieve the simulation against scaling factors. The expansion of equation [3] given specific dimension transforms not mentioned here give equation [4] to be solved.
 [4]
[4]
The expansion of equation [4] using coefficient collation and expansion by finite differences mentioned in equations [1] and [2] lead to equation [5]:
Equation [5] represents a series of concentrations that can be calculated independently from each other – each concentration can now be solved for each timestep (t) by an explicit algorithm for t+1 from t.
The explicit algorithm is uncommonly used in electrochemical simulation, often due to stability constraints and time taken to simulate. However, it offers complete parallelisation and low thread density – ideal for multi-processor systems and graphics cards – such that these issues should be overcome.
The explicit algorithm is stable when, for equation [4], the Courant–Friedrichs–Lewy condition [6] holds.
 [6]
[6]
Thus the upper bound on the time step is fixed given the minimum grid spacing used.
There are variations of the explicit algorithm to improve this stability, such as the Dufort-Frankel method of considering the concentration at each point as the linear function of time, such that:
 [7]
[7]
However, this method requires knowledge of the concentrations of two steps before the current step, therefore doubling memory usage.
Application to this Review
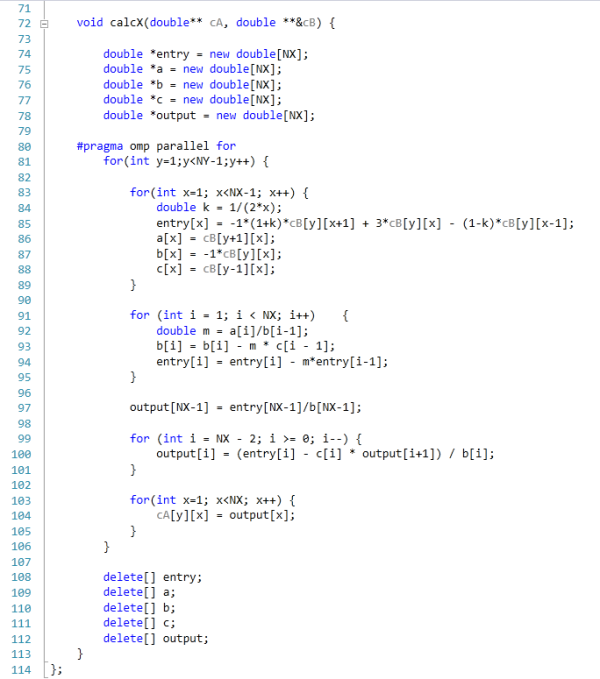
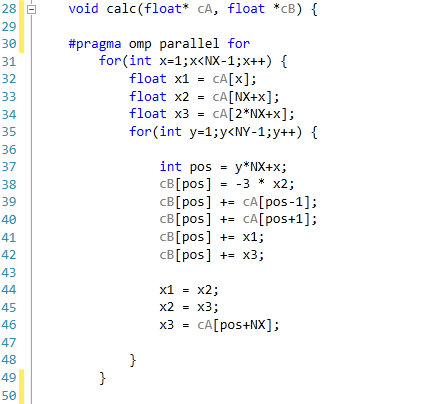
For the purposes of this review, we generate an x-by-x / x-by-x-by-x grid of points with a relative concentration of 1, where the boundaries are fixed at a relative concentration of 0. The grid is a regular grid, simplifying calculations. As each node in the grid is independently calculable from each other, it would be ideal to spawn as many threads as there are nodes. However, each node has to load the data of the nodes of the previous time step around it, thus we restrict parallelization in one dimension and use an iterative loop to restrict memory loading and increase simulation throughput.
The code was written in Visual Studio C++ 2012 with OpenMP as the multithreaded source. The main functions to do the calculations are as follows.
For 2D:
For 3D:
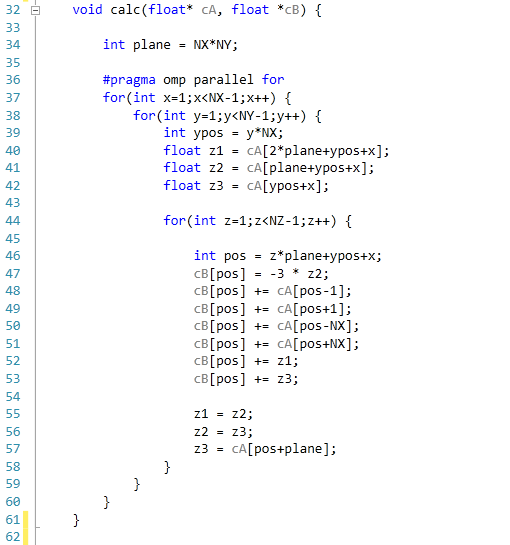
For our scores, we increase the size of the grid from a 2x2 or 2x2x2 until we hit 2GB memory usage. At each stage, the time taken to repeatedly process the grid over many time steps is calculated in terms of ‘million nodes per second’, and the peak value is used for our results.
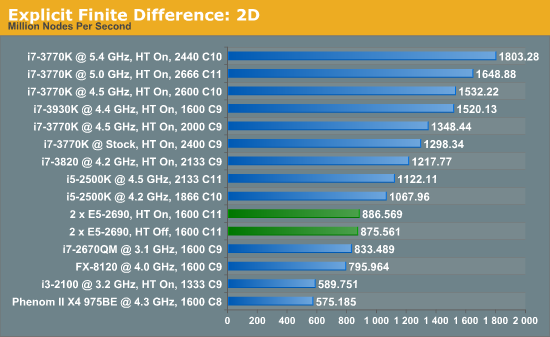
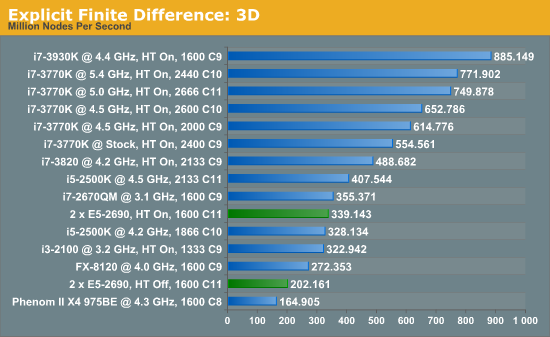
Firstly, the results for our 2D and 3D Explicit Finite Difference simulations are shocking. In 3D, the dual processor system gets beaten by a mobile i7-2670QM (!). In both 2D and 3D, it seems being able to quickly access main memory and L3 caches is top priority. Each processor in the DP machine has to go out to memory when they need a value not in cache, whereas in a single processor machine it can access the L3 cache if the simulation fits wholly in there and the processor can predict which numbers are required next.
Also it should be noted that enabling HyperThreading in 3D gave a better than 50% increase in throughput on the dual processor machine.
Two Dimensional Implicit Finite Difference
The ‘Finite Difference’ part of this computational grid solver means that the derivation of this method is similar to that shown in the Explicit Finite Difference method on the previous page. We are presented with the following equation which explains Fick’s first law of diffusion for mass transport in three dimensions:
 [8]
[8]
The implicit method takes the view that the concentrations at time t+1 are a series of unknowns, and the equations are thus coupled into a series of simultaneous equations with an equal set of unknowns, which must be solved together:
 [9]
[9]
 [10]
[10]
The implicit method is algorithmically more complex than the explicit method, but does offer the advantage of unconditional stability with respect to time.
The Alternating Direction Implicit (ADI) Method
For a system in two dimensions (labelled r and z), such as a microdisk simulation, the linear system has to be solved in both directions using Fick’s Laws:

 [11]
[11]
The alternating direction implicit (ADI) method is a straightforward solution to solving what are essentially two dimensional simultaneous equations whilst retaining a high degree of algorithm stability.
ADI splits equation [11] into two half time steps – by treating one dimension explicitly and the other dimension implicitly in the same half time step. Thus the explicit values known in one direction are fed into the series of simultaneous equations to solve the other direction. For example, using the r direction explicitly to solve the z direction implicitly:
 [12]
[12]
By solving equation [13] for the concentrations in the z direction, the next half time step concentrations can be calculated for the r direction, and so on until the desired time in simulation is achieved. These time step equations are solved using the Thomas Algorithm for tri-diagonal matrices.
Application to this Review
For the purposes of this review, we generate an x-by-x grid of points with a relative concentration of 1, where the boundaries are fixed at a relative concentration of 0. The grid is a regular grid, simplifying calculations. The nature of the simulation allows that for each half-time step to focus on calculating in one dimension, for a simulation of x-by-x nodes we can spawn x threads as adjacent rows/columns (depending on direction) are independent. These threads, in comparison to the explicit finite difference, are substantially bulkier in terms of memory usage.
The code was written in Visual Studio C++ 2012 with OpenMP as the multithreaded source. The main function to do the calculations is as follows.
For our scores, we increase the size of the grid from a 2x2 until we hit 2GB memory usage. At each stage, the time taken to repeatedly process the grid over many time steps is calculated in terms of ‘million nodes per second’, and the peak value is used for our results.
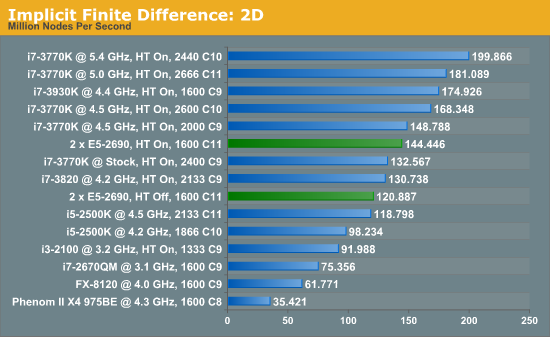
Previously where the explicit 2D method was indifferent to HyperThreading and the explicit 3D method was very sensitive; the implicit 2D is a mix of both. There are still benefits to be had from enabling HyperThreading. Nevertheless, the line between single processor systems and dual processors is being blurred a little due to the different speeds of the SP results, but in terms of price/performance, the DP system is at the wrong end.
Brownian Motion
When chemicals move around in the air, or dissolved in a liquid, or even travelling through a solid, they diffuse from an area of high concentration to low concentration, or follow Le Chatelier’s principle if an external force is applied. Typically this movement is described via an overall statistical shift, expressed as a partial differential equation. However, if we were to pick out an individual chemical and observe its movements, we would see that it moves randomly according to thermal energy – at every step it moves in a random direction until an external force (such as another chemical gets in the way) is encountered. If we sum up the movements of millions or billions of such events, we get the gradual motion explained by statistics.
The purpose of Brownian motion simulation is to calculate what happens to individual chemicals in circumstances where the finite motion is what dictates the activity occurring. For example, experiments dealing with single molecule detection rely on how a single molecule moves, or during deposition chemistry, the movement of individual chemicals will dictate how a surface achieves deposition in light of other factors. The movement of the single particle is often referred to a Random Walk (of which there are several types).
There are two main differences between a random-walk simulation and the finite difference methods used over the previous pages. The first difference is that in a random walk simulation each particle in the simulation is modelled as a point particle, completely independent in its movement with respect to other particles in the simulation (the diffusion coefficient in this context is indirectly indicative of the medium through which the particle is travelling through). With point particles, the interactions at boundaries can be quantized with respect to the time in simulation. From the perspective of independent particles, we can utilise various simulation techniques designed for parallel problems, such as multi-CPU analysis or using GPUs. To an extent, this negates various commentaries which criticise the random-walk method for being exceedingly slow.
The second difference is the applicability to three dimensional simulations. Previous methods for tackling three dimensional diffusion (in the field I was in) have relied on explicit finite difference calculation of uncomplicated geometries, which result in large simulation times due to the unstable nature of the discretisation method. The alternating direction implicit finite difference method in three dimensions has also been used, but can suffer from oscillation and stability issues depending on the algorithm method used. Boundary element simulation can be mathematically complex for this work, and finite element simulation can suffer from poor accuracy. The random-walk scenario is adaptable to a wide range of geometries and by simple redefinition of boundaries and/or boundary conditions, with little change to the simulation code.
In a random walk simulation, each particle present in the simulation moves in a random direction at a given speed for a time step (determined by the diffusion coefficient). Two factors computationally come into play – the generation of random numbers, and the algorithm for determining the direction in which the particle moves.
Random number generation is literally a minefield when first jumped into. Anyone with coding experience should have come across a rand() function that is used to quickly (and messily) generate a random number. This number as a function of the language library repeats itself fairly regularly, often within 2^15 (32768) steps. If a simulation is dealing with particles doing 100,000 steps, or billions of particles, this random number generator is not sufficient. For both CPU and GPU there are a number of free random number generators available, and ones like the Mersenne Twister are very popular. We use the Ranq1 random number generator found in Numerical Recipes 3rd Edition: The Art of Scientific Computing by Press et al., which features a quick generation which has a repeated stepping of ~1.8 x 10^19. Depending on the type of simulation contraints, in order to optimize the speed of the simulation, the random numbers can be generated in an array before the threads are issued and the timers started then sent through the function call. This uses additional memory, but is observed to be quicker than generating random numbers on the fly in the movement function itself.
Random Movement Algorithms
Trying to generate random movement is a little trickier than random numbers. To move a certain distance from an original point, the particle could end up anywhere on the surface of a sphere. The algorithm to generate such movement is not as trivial as a random axial angle followed by a random azimuth angle, as this generates movement biased at the poles of a sphere. By doing some research, I published six methods I had found for generating random points on the surface of a sphere.
For completeness, the notation x ~ U(0,1] means that x is a uniformly generated single-ended random number between 0 and 1.
(i) Cosine Method
In spherical polar coordinates, the solid angle of a sphere, Ω, is defined as the area A covered by that angle divided by the square of the radius, re, as shown in equation 14. The rate of change of this angle with respect to the area at constant radius gives the following set of equations:
 [14]
[14]
 [15]
[15]
 [16]
[16]
Thus Θ has a cosine weighting. This algorithm can then be used by following these steps:
Generate  [17]
[17]
Generate  [18]
[18]
 [19]
[19]
 [20]
[20]
 [21]
[21]
Computationally, 2π can be predefined as a constant, and thus does not require a multiplication every time it is used.
(ii) Normal-Deviate Method
As explained by Knuth, each x, y and z coordinate is randomly generated from a normal distribution with a mean of 0 and variance of 1. The result is normalised to the surface of the sphere to obtain a uniform distribution on the surface. The following equations describe this method, where λis the normalisation factor:
Let u, v, w ~ N(0,1), λ = Rm / sqrt(u2+v2+w2) [22]
x = uλ, y = vλ, z = wλ [23]
It should be noted that the generation of normally distributed random numbers requires an element of rejection, and thus generating normal random numbers takes significantly longer than generating uniform random numbers.
(iii) Hypercube rejection method
Similar to the normal-deviate method, but each ordinate is uniformly randomly distributed on [-1, 1] (calculated as 2 x U(0,1]-1). Compute the square root of the sum of squares, and if this value is greater than 1, the triplet is rejected. If this value is below 1, the vector is normalised and scaled to Rm.
Generate u, v, w ~ 2 * U(0,1] - 1 [24]
Let s2 = u2 + v2 + w2; if s>1, reject, else λ = Rm/s [25]
x = uλ, y = vλ, z = wλ [26]
As this method requires comparison and rejection, the chance of a triplet being inside the sphere as required is governed by the areas of a cube and sphere, such that 6/3.141 ≈ 1.910 triplets are required to achieve one which passes comparison.
(iv) Trigonometric method
This method is based on the fact that particles will be uniformly distributed on the sphere in one axis. The proof of this has been published in peer reviewed journals. The uniform direction, in this case Z, is randomly generated on [-Rm, Rm] to find the circle cross section at that point. The particle is then distributed at a random angle on the XY plane due to the constraint in Z.
Generate z ~ 2 x Rm x U(0,1] - Rm [27]
Generate α ~ 2π x U(0,1] [28]
Let r = sqrt(Rm2 – z2) [29]
x = r cos(α) [30]
y = r sin(α) [31]
(v) Two-Dimensional rejection method
By combining methods (iii) and (iv), a form of the trigonometric method can be devised without the use of trigonometric functions. Two random numbers are uniformly distributed along [-1, 1]. If the sum of squares of the two numbers is greater than 1, reject the doublet. If accepted, the ordinates are calculated based on the proof that points in a single axis are uniformly distributed:
Generate u, v ~ 2 x U(0,1] - 1 [32]
Let s = u2 + v2; if s > 1, reject. [33]
Let a = 2 x sqrt(1-s); k = a x Rm [34]
x = ku, y = kv, z = (2s-1)Rm [35]
Use of this method over the trigonometric method described in (iii) is dependent on whether the trigonometric functions of the system are slower than the combined speed of rejection and regeneration of the random numbers.
(vi) Bipyramidal Method
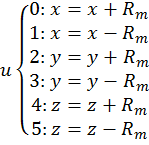
For completeness, the bipyramidal diffusion modelis also included. This method generates a random whole number between 0 and 5 inclusive, which dictates a movement in an axis, either positive or negative relative to the starting position. As a result, the one-dimensional representation of the random-walk, as shown in Figure 3, is played out in each of the three dimensions, and any particles that would have ended up outside the bipyramid from methods (i-v) would now be inside the pyramid.
The method for bipyramidal diffusion is shown below:
Generate  where
where  is the floor function
 [36]
[36]
This method is technically the computationally least expensive in terms of mathematical functions, but due to equation [36], requires a lot of ‘if’ type comparison statements and the speed of these will determine how fast the algorithm is.
Results
The Brownian motion tests are something I have been doing with motherboard reviews for over twelve months in the form of my 3DPM (Three-Dimensional Particle Movement) test in both single threaded and multithreaded form. The simulation generates a number of particles, iterates them through a number of steps, and then checks the time to see if 10 seconds have passed. If the 10 seconds are not up, it goes through another loop. Results are then expressed in the form of million particle movements per second.
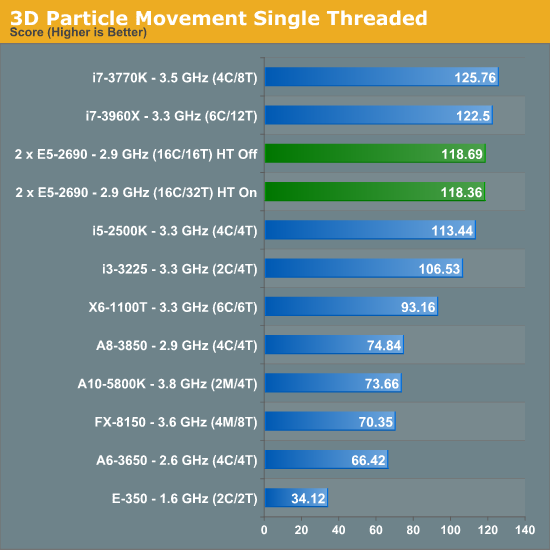
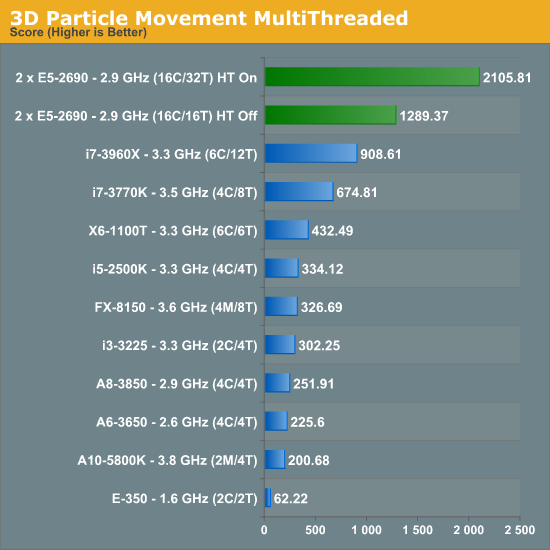
Due to the nature of the simulation, absolutely no memory access are needed during computation - there is a small element at the end for addition. This makes the DP system excellent for this type of work. Perhaps unsurprisingly we see no change in our single threaded version with HyperThreading on or off. However with the multithreaded version, HyperThreading gets a massive 63.3% boost.
Abusing GPUs
Back when I was researching these methods and implementing them on GPUs, for method (iv), the fastest method, the following results were achieved:
Athlon X2 5050e, 2.6 GHz (2C/2T): 32.38
Dual Xeon E5520, 2.23 GHz (8C/16T): 230.63
NVIDIA Quadro 580, 32 CUDA Cores: 1041.80
NVIDIA GTX 460, 336 CUDA Cores: 13602.94
When the simulation is embarrassingly parallel like this one, GPUs make a lot of difference. I recently rewrote method (iv) in C++ AMP and ran it on a i7-3770K at stock with a HD7970 also at stock, paired with 2400 C9 memory. It gave a result of 73654.32.
For the purpose of this review, I delved into C++ AMP as a natural extension to my GPU programming experience. For users wanting to go down the GPU programming route, C++ AMP is a great way to get involved. As a high level language it is easy enough to learn, and the book on sale as well as the MSDN blogs online are also very helpful, moreso perhaps than CUDA.
Part of the available code online for C++ AMP revolves around n-body simulations, as the basis of an n-body simulation maps nicely to parallel processors such as multi-CPU platforms and GPUs. For this review, I was able to strip out the code from the n-body example provided and run some numbers. Many thanks to Boby George and Jonathan Emmett from Microsoft for their help.
The n-Body Simulation
When a series of heavy mass elements are in space, they interact with each other through the force of gravity. Thus when a star cluster forms, the interaction of every large mass with every other large mass defines the speed at which these elements approach each other. When dealing with millions and billions of stars on such a large scale, the movement of each of these stars can be simulated through the physical theorems that describe the interactions.
n-Body simulation is a large field of calculation with many different computational methods optimized for speed, memory usage or bus transfer – this is on top of the different algorithms that can be used to represent such a scenario. Typically one might expect the running time of a simulation be O(n^2) as each particle in the simulation has to interact gravitationally with every other particle, but some computational methods can be used to reduce this as the effect of gravity is inversely proportional to the square of the distance, and thus only the localized area needs to be known. Other complex solutions deal with general relativity. I am neither an expert in gravity simulations or relativity, but the solution used today is the full O(n^2) solution.
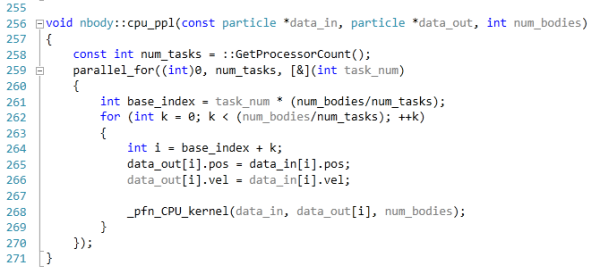
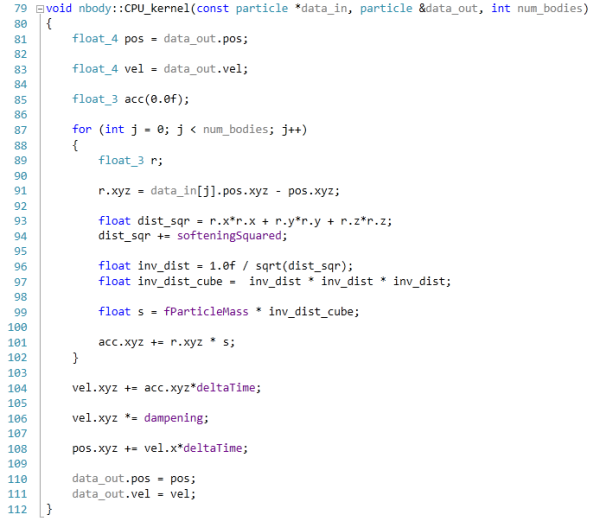
The code provided detects whether the processor is SSE2 or SSE4 capable, and implements the relative code. Here is an example of the multi-CPU code, using the PPL library, and the non-SSE enabled function:
This code is run using a simulation of 10240 particles of equal mass. The output for this code is in terms of GFLOPs, and the result recorded was the peak GFLOPs value.
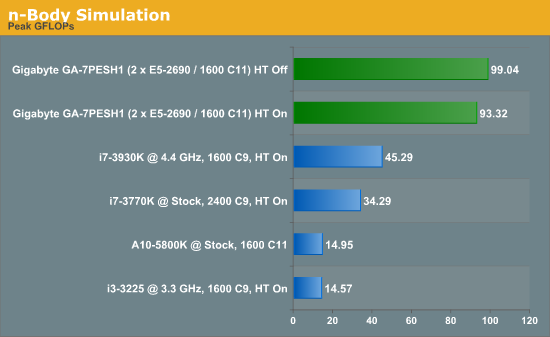
In the case of our dual processor system, disabling HyperThreading gives a modest 6% boost, suggesting that the cache sizes of the processors used are slightly too small. Note that for this simulation, the data of every particle is stored in as low cache as possible, then read by each particle, and the main write is pushed out to main memory. Then for the next step, a copy of main memory is again made to the L3 cache of each processor and the process repeated. For this type of task, the dual processor systems are ideal, but like the Brownian motion simulation, moving them onto a GPU gets an even better result (700 GFLOPs on a GTX560).
As part of this review, we also ran our normal motherboard benchmarks.
WinRAR x64 3.93 - link
With 64-bit WinRAR, we compress the set of files used in the USB speed tests. WinRAR x64 3.93 attempts to use multithreading when possible, and provides as a good test for when a system has variable threaded load. If a system has multiple speeds to invoke at different loading, the switching between those speeds will determine how well the system will do.
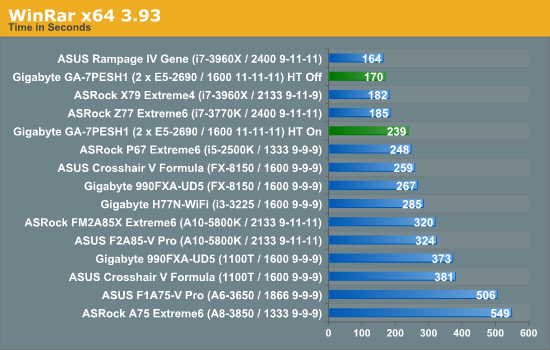
WinRAR is another example where enabling HyperThreading is actually hurting the throughput of the system. But even with all 32 threads in the system, the lack of memory speed hurts the benchmark.
FastStone Image Viewer 4.2 - link
FastStone Image Viewer is a free piece of software I have been using for quite a few years now. It allows quick viewing of flat images, as well as resizing, changing color depth, adding simple text or simple filters. It also has a bulk image conversion tool, which we use here. The software currently operates only in single-thread mode, which should change in later versions of the software. For this test, we convert a series of 170 files, of various resolutions, dimensions and types (of a total size of 163MB), all to the .gif format of 640x480 dimensions.
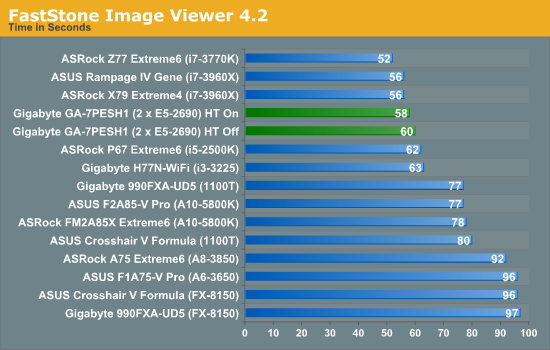
FastStone is relatively unaffected due to the single-threaded nature of the program.
Xilisoft Video Converter
With XVC, users can convert any type of normal video to any compatible format for smartphones, tablets and other devices. By default, it uses all available threads on the system, and in the presence of appropriate graphics cards, can utilize CUDA for NVIDIA GPUs as well as AMD APP for AMD GPUs. For this test, we use a set of 33 HD videos, each lasting 30 seconds, and convert them from 1080p to an iPod H.264 video format using just the CPU. The time taken to convert these videos gives us our result.
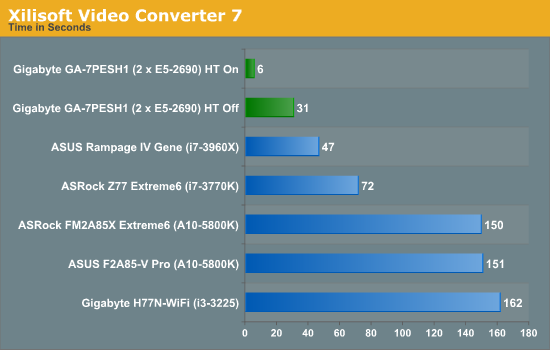
With XVC having many threads is what wins the day, and having HT enabled made the process very fast indeed. With HT on, we have 32 threads, meaning most of the videos were actually converted very quickly – the final 33rd video caused an extra delay at the end. This is yet another example of an algorithm that can be ported to GPUs, as XVC offers both an AMD and NVIDIA option for conversion.
x264 HD Benchmark
The x264 HD Benchmark uses a common HD encoding tool to process an HD MPEG2 source at 1280x720 at 3963 Kbps. This test represents a standardized result which can be compared across other reviews, and is dependant on both CPU power and memory speed. The benchmark performs a 2-pass encode, and the results shown are the average of each pass performed four times.
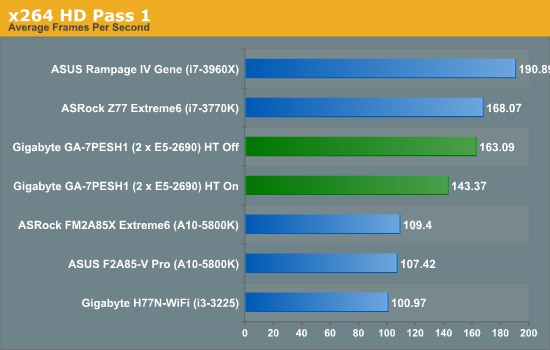
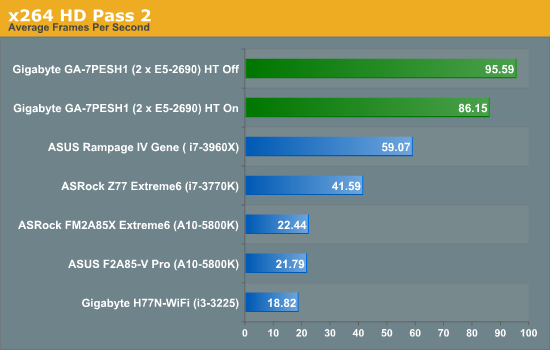
In contrast to XVC, which splits its threads across many files, the x264 HD benchmark splits threads across one file. As a result it seems that having HT off gives a subtle 13.7% boost in performance in the first pass and 11.0% boost in the second pass. The results of the first pass makes the second pass a lot more efficient across all the threads due to fewer memory accesses.
USB Speed
For this benchmark, we run CrystalDiskMark to determine the ideal sequential read and write speeds for the USB port using our 240 GB OCZ Vertex3 SSD with a SATA 6 Gbps to USB 3.0 converter. Then we transfer a set size of files from the SSD to the USB drive using DiskBench, which monitors the time taken to transfer. The files transferred are a 1.52 GB set of 2867 files across 320 folders – 95% of these files are small typical website files, and the rest (90% of the size) are the videos used in the Sorenson Squeeze test.
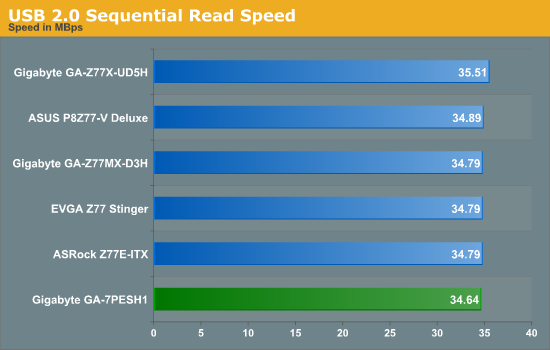
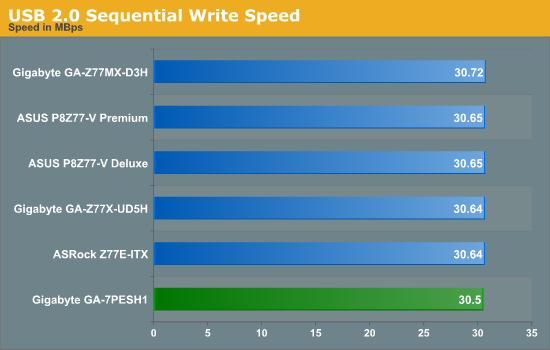
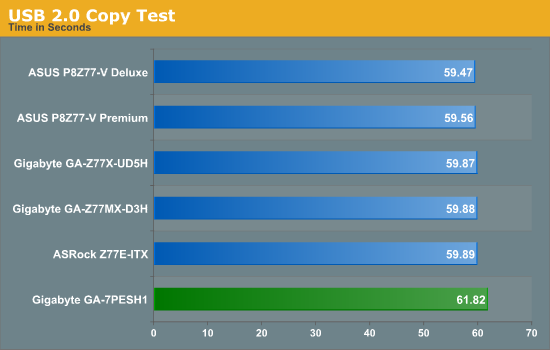
USB speed is dictated by the chipset and the BIOS implementation, and the GA-7PESH1 performance is comparable to our Z77/X79 testing.
DPC Latency
Deferred Procedure Call latency is a way in which Windows handles interrupt servicing. In order to wait for a processor to acknowledge the request, the system will queue all interrupt requests by priority. Critical interrupts will be handled as soon as possible, whereas lesser priority requests, such as audio, will be further down the line. So if the audio device requires data, it will have to wait until the request is processed before the buffer is filled. If the device drivers of higher priority components in a system are poorly implemented, this can cause delays in request scheduling and process time, resulting in an empty audio buffer – this leads to characteristic audible pauses, pops and clicks. Having a bigger buffer and correctly implemented system drivers obviously helps in this regard. The DPC latency checker measures how much time is processing DPCs from driver invocation – the lower the value will result in better audio transfer at smaller buffer sizes. Results are measured in microseconds and taken as the peak latency while cycling through a series of short HD videos - under 500 microseconds usually gets the green light, but the lower the better.
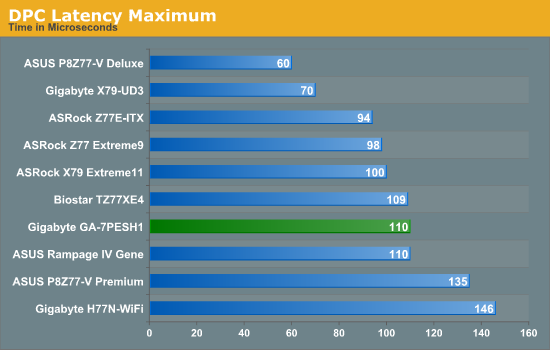
As a workstation motherboard, having a low DPC latency would be critical for recording and analyzing time sensitive information. Scoring 110 microseconds at its peak latency is great for this motherboard.
Put me in front of a dual processor motherboard and a pair of eight core Xeons with HyperThreading and I will squeal with delight. Then I will take it to the cleaners with multithreaded testing to actually see how good it is. Watching a score go up or the time taken to do a test going down is part of the parcel as a product reviewer, so watching the score go higher or the time taken going down is almost as good as product innovation.
Back in research, two things can drive the system: publication of results and future relevance for those results. Understanding the system to get results is priority number one, and then being able to obtain results could be priority number two. In theoretical fields, where a set of simulations can take from seconds to months and even years, having the hardware to deal with many simulations (or threads within a simulation) and the single threaded speed means more results per unit time. Extremely useful when you get a weeks worth of results back and you missed a negative sign in the code (happens more often than you think). Some research groups, with well-developed code, take it to clusters. Modern takes on the code point towards GPUs, if the algorithm allows, but that is not always the case.
So when it comes to my perspective on the GA-7PESH1, I unfortunately do have not much of a comparison to point at. As an overclocking enthusiast, I would have loved to see some overclock, but the only thing a Sandy Bridge-E processor with an overclock will do is increase single threaded speed – the overall multithreaded performance on most benchmarks is still below an i7-3960X at 5 GHz (from personal testing). For simulation performance, it really depends on the simulation itself if it will blaze though the code while using ~410 watts.
Having an onboard 2D chip negates needing a dedicated display GPU, and the network interfaces allow users to remotely check up on system temperatures and fan speeds to reduce overheating or lockups due to thermals. There are plenty of connections on board for mini-SAS cabling and devices, combined with an LSI SAS chip if RAID is a priority. The big plus point over consumer oriented double processor boards is the DIMM slot count, with the GA-7PESH supporting up to 512 GB.
Compared to the consumer oriented dual processor motherboards available, one can criticize the GA-7PESH1 for not being forthcoming in terms of functionality. I would have assumed that being a B2B product that it would be highly optimized for efficiency and a well-developed platform, but the lack of discussion and communication between the server team and the mainstream motherboard team is a missed opportunity when it comes to components and user experience.
This motherboard has been reviewed in a few other places around the internet with different foci with respect to the reviewer experience. One of the main criticisms was the lack of availability – there is no Newegg listing and good luck finding it on eBay or elsewhere. I send Gigabyte an email, to which I got the following response:
-
Regarding the availability in the US, so far all our server products are available through our local branch, located at:
17358 Railroad St.
City of Industry
CA 91748
+1-626-854-9338
As a result of being a B2B product, pricing for the GA-7PESH1 (or the GA-7PESH2, its brother with a 10GbE port) is dependent on individual requirements and bulk purchasing. In contrast, the ASUS Z9PE-D8 WS is $580, and the EVGA SR-X is $650.
Review References for Simulations:
[1] Stripping Voltammetry at Microdisk Electrode Arrays: Theory, IJ Cutress, RG Compton, Electroanalysis, 21, (2009), 2617-2625.
[2] Theory of square, rectangular, and microband electrodes through explicit GPU simulation, IJ Cutress, RG Compton, Journal of Electroanalytical Chemistry, 645, (2010), 159-166.
[3] Using graphics processors to facilitate explicit digital electrochemical simulation: Theory of elliptical disc electrodes, IJ Cutress, RG Compton, Journal of Electroanalytical Chemistry, 643, (2010), 102-109.
[4] Electrochemical random-walk theory Probing voltammetry with small numbers of molecules: Stochastic versus statistical (Fickian) diffusion, IJ Cutress, EJF Dickinson, RG Compton, Journal of Electroanlytical Chemistry, 655, (2011), 1-8.
[5] How many molecules are required to measure a cyclic voltammogram? IJ Cutress, RG Compton, Chemical Physics Letters, 508, (2011), 306-313.
[6] Nanoparticle-electrode collision processes: Investigating the contact time required for the diffusion-controlled monolayer underpotential deposition on impacting nanoparticles, IJ Cutress, NV Rees, YG Zhou, RG Compton, Chemical Physics Letters, 514, (2011), 58-61.
[7] D. Britz, Digital Simulation Electrochemistry, in: D. Britz (Ed.), Springer, New York, 2005, p. 187.
[8] W.H. Press, S.A. Teukolsky, W.T. Vetterling, B.P. Flannery, Numerical Recipes: The Art of Scientific Computing, Cambridge University Press, 2007.
[9] D.E. Knuth, in: D.E. Knuth (Ed.), Seminumerical Algorithms, Addison-Wesley, 1981, pp. 130–131
[10] K.Gregory, A.Miller, C++ AMP: Accelerated Massive Parallelism with Microsoft Visual C++, 2012, link.
+ others contained within the references above.






 [5]
[5]
