The 2TB Samsung 850 Pro & EVO SSD Review
by Kristian Vättö on July 23, 2015 10:00 AM ESTPerformance Consistency
We've been looking at performance consistency since the Intel SSD DC S3700 review in late 2012 and it has become one of the cornerstones of our SSD reviews. Back in the days many SSD vendors were only focusing on high peak performance, which unfortunately came at the cost of sustained performance. In other words, the drives would push high IOPS in certain synthetic scenarios to provide nice marketing numbers, but as soon as you pushed the drive for more than a few minutes you could easily run into hiccups caused by poor performance consistency.
Once we started exploring IO consistency, nearly all SSD manufacturers made a move to improve consistency and for the 2015 suite, I haven't made any significant changes to the methodology we use to test IO consistency. The biggest change is the move from VDBench to Iometer 1.1.0 as the benchmarking software and I've also extended the test from 2000 seconds to a full hour to ensure that all drives hit steady-state during the test.
For better readability, I now provide bar graphs with the first one being an average IOPS of the last 400 seconds and the second graph displaying the IOPS divided by standard deviation during the same period. Average IOPS provides a quick look into overall performance, but it can easily hide bad consistency, so looking at standard deviation is necessary for a complete look into consistency.
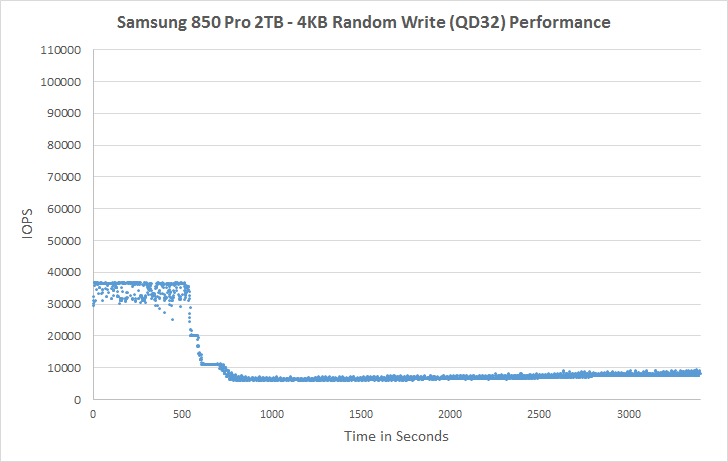
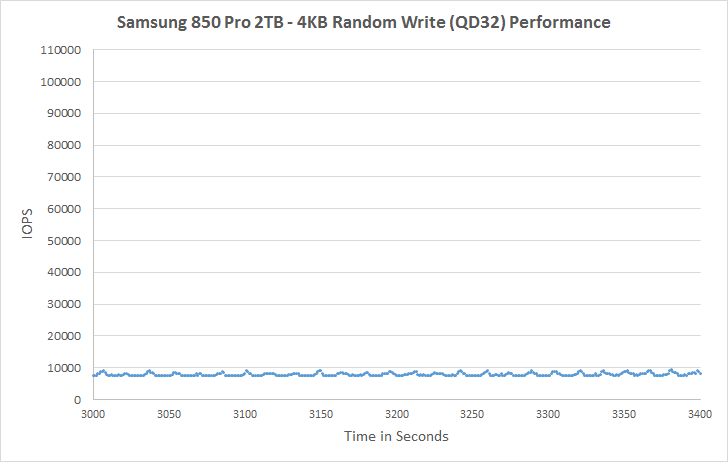
I'm still providing the same scatter graphs too, of course. However, I decided to dump the logarithmic graphs and go linear-only since logarithmic graphs aren't as accurate and can be hard to interpret for those who aren't familiar with them. I provide two graphs: one that includes the whole duration of the test and another that focuses on the last 400 seconds of the test to get a better scope into steady-state performance. These results are for all drives 240GB and up.
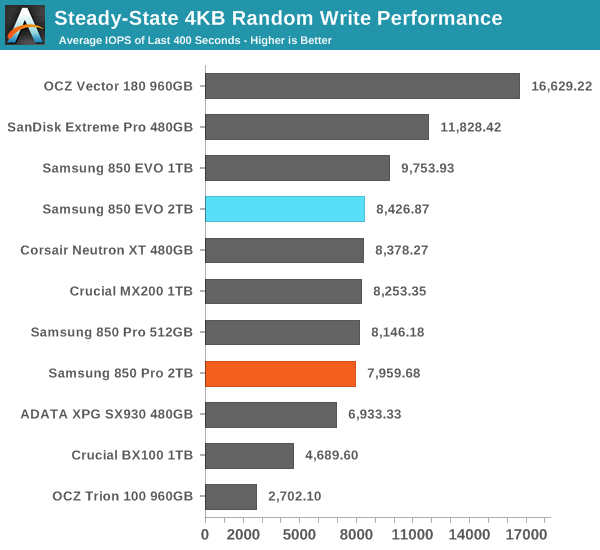
In steady-state 4KB random write performance the EVO is actually slightly faster than the Pro, but given that the EVO employs more over-provisioning (12% vs 7%), it's not out of the ordinary. The 2TB EVO performs slightly lower than the 1TB model, so it seems that despite the upgraded DRAM controller the controller may not be ideal for more than 1TB of NAND (internal SRAM caches and the like are the same as in the MEX controller). Nevertheless, the difference isn't substantial and in any case the Pro and EVO both boast excellent steady-state performance.
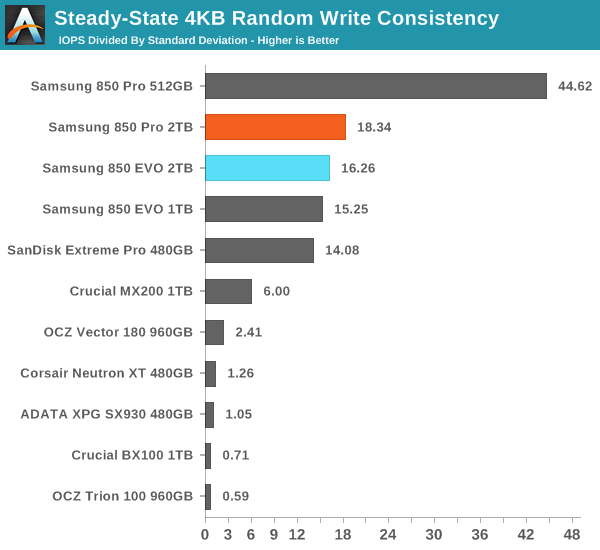
Both 2TB drives also have great consistency, although the 2TB Pro can't challenge the 512GB Pro that clearly leads the consistency graph. Given the same amount of raw processing power, managing less NAND is obviously easier because the more NAND there is, the more garbage collection calculations the controller has to process, which results in increased variation in performance.
 |
|||||||||
| Default | |||||||||
| 25% Over-Provisioning | |||||||||
The behavior in steady-state is similar to other 850 Pro and EVO drives, which is hardly surprising given the underlying firmware similarities. One area to note, though, is the increased performance variation with additional over-provisioning (OP), whereas especially the 512GB Pro presents very consistent performance with 25% OP. In any case, performance with additional OP is class-leading in both Pro and EVO.
 |
|||||||||
| Default | |||||||||
| 25% Over-Provisioning | |||||||||


66 Comments
View All Comments
leexgx - Saturday, July 25, 2015 - link
the max speed of SATA interface (any thing higher sequential 500mb/s sequential i would not even bother to look at sequential speed tests)with SSDs its the random speeds you should be looking at, as its not the sequential speed that makes a SSD fast (that is depending what your doing that is as a SSD sequential is still 3x faster then a HDD) as random access can be 20-80mb/s on SSD (random access tends to be as low as 0.5mb/s on a HDD or lower)
Kristian Vättö - Sunday, July 26, 2015 - link
600MB/s is the theoretical maximum after 8b/10b encoding. However, there are other overheads (e.g. AHCI) that lead the maximum performance in real world being about 560MB/s.DIYEyal - Friday, July 24, 2015 - link
Great review as always!By the way, I found a typo in page 4: "or full details of the test, please refer to the this article."
mark53916 - Friday, July 24, 2015 - link
Very good review, especially the wide gamut of the tests and theability to see graphs for competing devices.
However, you still have left out:
file copy: single stream and multiple stream.
The tests on:
http://www.anandtech.com/show/9451/the-2tb-samsung...
The 2TB Samsung 850 Pro & EVO SSD Review
Mixed Random Read/Write Performance
and
http://www.anandtech.com/show/9451/the-2tb-samsung...
The 2TB Samsung 850 Pro & EVO SSD Review
SEQUENTIAL PERFORMANCE
are good, but the reviews should include COPY tests. (Write Sequentially
and Read Sequentially are not the same as COPY sequentially, and many devices
have much less than 1/2 of the performance that would be expected if the devices
were "perfect". For example if read sequential and write sequential were 550MB/s,
one would expect at least 275MB/s for COPY, but might see only 100MB/s.
[Since you will see that there some devices are able to copy at speeds above 250MB/s,
you would know that drop in the copy speed to less than 1/2 of the write speed
and read speed is a limit of the device under test, and not due to your
configuration.] )
Thank you, especially for the power graphs and over-provisioned performance data:
http://www.anandtech.com/show/9451/the-2tb-samsung...
The 2TB Samsung 850 Pro & EVO SSD Review
Performance Consistency
However
Samsung 850 Pro 2TB 25% OP - 4KB Random Write (QD32) Performance
used less than 37000 writes/second *4K bytes/write* 3400 seconds
Rounding up, I calculate that the total data written,
excluding the write amplification factor is less than
4E4 writes/second*4E3 seconds* 4KB/write = 1.6E8 *4KB
so less than 160 M *4KB
The over-provisioning was at least 512GB=
512M *4KB
So, unless the write amplification factor was larger than about
3 the steady state hasn't been reached. I expect that the write
amplification factor was less than 2; given the amount
of over provision it likely less than 1.25. Therefore I
think at least 3 hour runtime is needed, maybe 4 hours. 6
hours seems like longer than needed.
Note that the Samsung 850 Pro 2TB likely to be able to erase
blocks for use at a much higher speed than the external write
speed that is being measured, but the still could be a change
in performance at some point.
Nitpick: The packaging and labels on all my 850 PRO stuff (up to 1TB) say
"PRO" not "Pro".
Kristian Vättö - Sunday, July 26, 2015 - link
For enterprise drives, we run a longer six-hour 4KB random write test to measure steady-state to ensure that it's really steady state. For client drives an hour of 4KB random writes at QD32 is already unrealistic and it gives us data that is a fairly accurate representation of steady-state performance while keeping the test duration shorter to increase our test throughput.Navier - Sunday, July 26, 2015 - link
Where are the Intel SSDs for comparison? Historically Intel drives have the most consistent drive performance across the entire drive cycle and use cases. However the Intel 730, and 500 series SATA drives are omitted from the comparisons. Why?Kristian Vättö - Sunday, July 26, 2015 - link
I've only had limited time to put drives through our new 2015 Client SSD Suite and given that Intel drives haven't been the most competitive in the SATA client space for a while, they haven't been my top priority.akula2 - Monday, July 27, 2015 - link
>The Pro has been holding the performance crown for the past year and it's starting to look like no SATA drive can dethrone itProbably. However, I'd continue to overlook the recommendations of Samsung products when there exist alternative products (such as from SanDisk) with comparable performance plus for the lesser $ price. I've no interest in paying more to companies like Samsung, thus making them more rich and larger.
Note: I own many many SSDs of various types and makes. In my R&D and Manufacturing business domain, IT product performance matters but there is a price thresold at which one shouldn't cross (RoI) while procurding those products in bulk. It just doesn't make any sense to ignore $ saving per product each year. Note that Samsung 850 crashed their prices only a little while ago.
Impulses - Tuesday, July 28, 2015 - link
The EVO has had a mild to substantial price advantage on everything else for a few months now tho... Kinda makes the Pro's premium moot unless you're in some sorta edge case where the difference between them matters and there's some equivalent alternative that happens to be priced just between the two.TelstarTOS - Monday, July 27, 2015 - link
The 2TB EVO is a very interesting drive, perfect for a notebook.