Intel Haswell-EP Xeon 14 Core Review: E5-2695 V3 and E5-2697 V3
by Ian Cutress on November 20, 2014 10:00 AM EST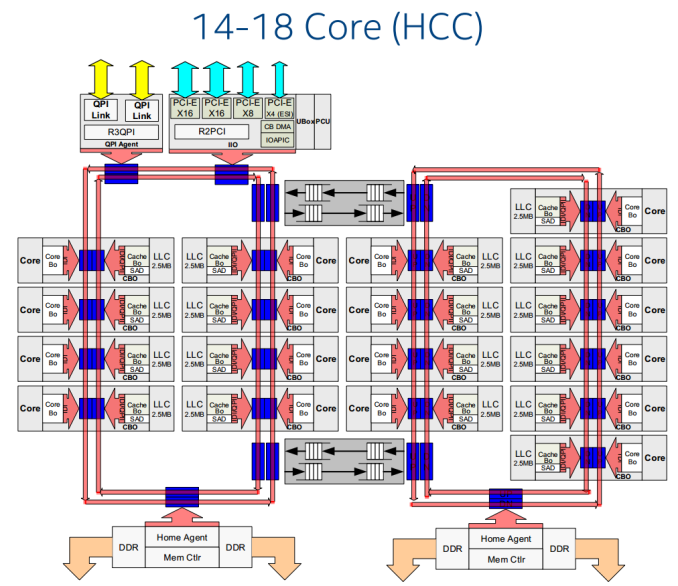
Moving up the Xeon product stack, the larger and more complicated the die, the lower the yield. Intel sells its 14-18 core Xeons from a top end design that weighs in at over five billion transistors, and we have had two of the 14C models in for review: the E5-2695 V3 (2.3 GHz, 3.3 GHz turbo) and E5-2697 V3 (2.6 GHz, 3.6 GHz turbo).
The Information
It can only take one particular transistor to fail to break a whole CPU. If it happens in a core as part of the logic or caches, that core can be fused off and the die can sold as a lower core part. This is how yields are improved, by reusing the dies that have errors in removable sections. Ultimately this reduces the maximum amount of profit on offer, but it enables CPU manufacturers like Intel and AMD to sell a range of products, rather than just one from a single design. The way Intel designs its high end E5 V3 Xeons, from an 18-core die, means that its 14 core components either have at least two defects, or are perfectly fine 18 core models but need to fill up demand.
| CPU Specification Comparison | |||||||||
| CPU | Node | Cores | GPU | Transistor Count (Schematic) |
Die Size | ||||
| Server CPUs | |||||||||
| Intel | Haswell-EP 14-18C | 22nm | 14-18 | N/A | 5.69B | 662mm2 | |||
| Intel | Haswell-EP 10C-12C | 22nm | 6-12 | N/A | 3.84B | 492mm2 | |||
| Intel | Haswell-EP 6C-8C | 22nm | 4-8 | N/A | 2.6B | 354mm2 | |||
| Intel | Ivy Bridge-EP 12C-15C | 22nm | 10-15 | N/A | 4.31B | 541mm2 | |||
| Intel | Ivy Bridge-EP 10C | 22nm | 6-10 | N/A | 2.89B | 341mm2 | |||
| Consumer CPUs | |||||||||
| Intel | Haswell-E 8C | 22nm | 8 | N/A | 2.6B | 356mm2 | |||
| Intel | Haswell GT2 4C | 22nm | 4 | GT2 | 1.4B | 177mm2 | |||
| Intel | Haswell ULT GT3 2C | 22nm | 2 | GT3 | 1.3B | 181mm2 | |||
| Intel | Ivy Bridge-E 6C | 22nm | 6 | N/A | 1.86B | 257mm2 | |||
| Intel | Ivy Bridge 4C | 22nm | 4 | GT2 | 1.2B | 160mm2 | |||
| Intel | Sandy Bridge-E 6C | 32nm | 6 | N/A | 2.27B | 435mm2 | |||
| Intel | Sandy Bridge 4C | 32nm | 4 | GT2 | 995M | 216mm2 | |||
| Intel | Lynnfield 4C | 45nm | 4 | N/A | 774M | 296mm2 | |||
| AMD | Trinity 4C | 32nm | 4 | 7660D | 1.303B | 246mm2 | |||
| AMD | Vishera 8C | 32nm | 8 | N/A | 1.2B | 315mm2 | |||
I mentioned in the 12 core review that Intel can play fast and loose with their binning process, giving customers almost what they desire in terms of performance and power, as long as they are willing to pay that price. The same could be said for the 14-18 core market, but rather than offer a swathe of units, Intel offers around half a dozen ranging from a 2.0 GHz 14-core to the E5-2699 V3 2.3 GHz 18-core. Intel could release a 65W, 18 core monster, and even though it might come through at 1.2 GHz, this type of SKU is not on the roadmap (unless, perhaps, you meet the high minimum order quantity). If given the opportunity, I would like to see the process by which Intel decides to select which SKUs to bin for retail vs. OEM and custom parts. I suspect it is a combination of part market demand, part yield, part wishful thinking, but I would hope it is at least systematic. Based on the core orientation image below, there might be complications dealing with that final column of six cores, against the other columns of four, either in voltage response characteristics or discrete production errors which might also have another effect.

Our samples in today come in with the E5-2695 V3 at 2.3 GHz base frequency (3.3 GHz turbo) and the E5-2697 V3 at 2.6 GHz (3.6 GHz turbo). When considering the Xeon naming stack, each number from 2695 to 2699 is taken except from 2696, and as such one might humorously postulate that Intel is merely running out of SKU names. Though an added L or W might find its way in if more models joined the list.
In our last test, as well as previous reviews, the results showed that a 2P system, such as the dual E5-2650L V3s, performed poorly in most of our testing software compared to having one big single CPU in a 1P socket in most circumstances. The 1P arrangement tends to outperform a 2P system when the software is not built to take advantage of the NUMA arrangement. Intel does sell CPUs like the E5-1691 V3, a 14 core chip for 1P systems, or we can go straight into the E5-2699 V3 for 18 cores, but there will always be a market for 2P players who need the large memory capacity or who use software similar to Cinema 4D that is NUMA aware.
| Intel Xeon E5 2600 v3 SKU Comparison | ||||
| Xeon E5 | Cores/ Threads |
TDP | Clock Speed (GHz) Base - Turbo |
Price |
| High Performance (35-45MB LLC) | ||||
| 2699 v3 | 18/36 | 145W | 2.3-3.6 | $4115 |
| 2698 v3 | 16/32 | 135W | 2.3-3.6 | $3226 |
| 2697 v3 | 14/28 | 145W | 2.6-3.6 | $2702 |
| 2695 v3 | 14/28 | 120W | 2.3-3.3 | $2424 |
| "Advanced" (20-30MB LLC) | ||||
| 2690 v3 | 12/24 | 135W | 2.6-3.5 | $2090 |
| 2685 v3 | 12/24 | 120W | 2.6-3.5 | $2090 |
| 2680 v3 | 12/24 | 120W | 2.5-3.3 | $1745 |
| 2660 v3 | 10/20 | 105W | 2.6-3.3 | $1445 |
| 2658 v3 (E) | 12/24 | 105W | 2.2-2.9 | $1832 |
| 2650 v3 | 10/20 | 105W | 2.3-3.0 | $1167 |
| Midrange (15-25MB LLC) | ||||
| 2640 v3 | 8/16 | 90W | 2.6-3.4 | $939 |
| 2630 v3 | 8/16 | 85W | 2.4-3.2 | $667 |
| 2620 v3 | 6/12 | 85W | 2.4-3.2 | $422 |
| Frequency optimized (10-20MB LLC) | ||||
| 2687W v3 | 10/20 | 160W | 3.1-3.5 | $2141 |
| 2667 v3 | 8/16 | 135W | 3.2-3.6 | $2057 |
| 2643 v3 | 6/12 | 135W | 3.4-3.7 | $1552 |
| 2637 v3 | 4/8 | 135W | 3.5-3.7 | $996 |
| Budget (15MB LLC) | ||||
| 2609 v3 | 6/6 | 85W | 1.9 | $306 |
| 2603 v3 | 6/6 | 85W | 1.6 | $213 |
| Power Optimized (20-30MB LLC) | ||||
| 2650L v3 | 12/24 | 65W | 1.8-2.5 | $1329 |
| 2648L v3 (E) | 12/24 | 75W | 1.8-2.5 | $1544 |
| 2630L v3 | 8/16 | 55W | 1.8-2.9 | $612 |
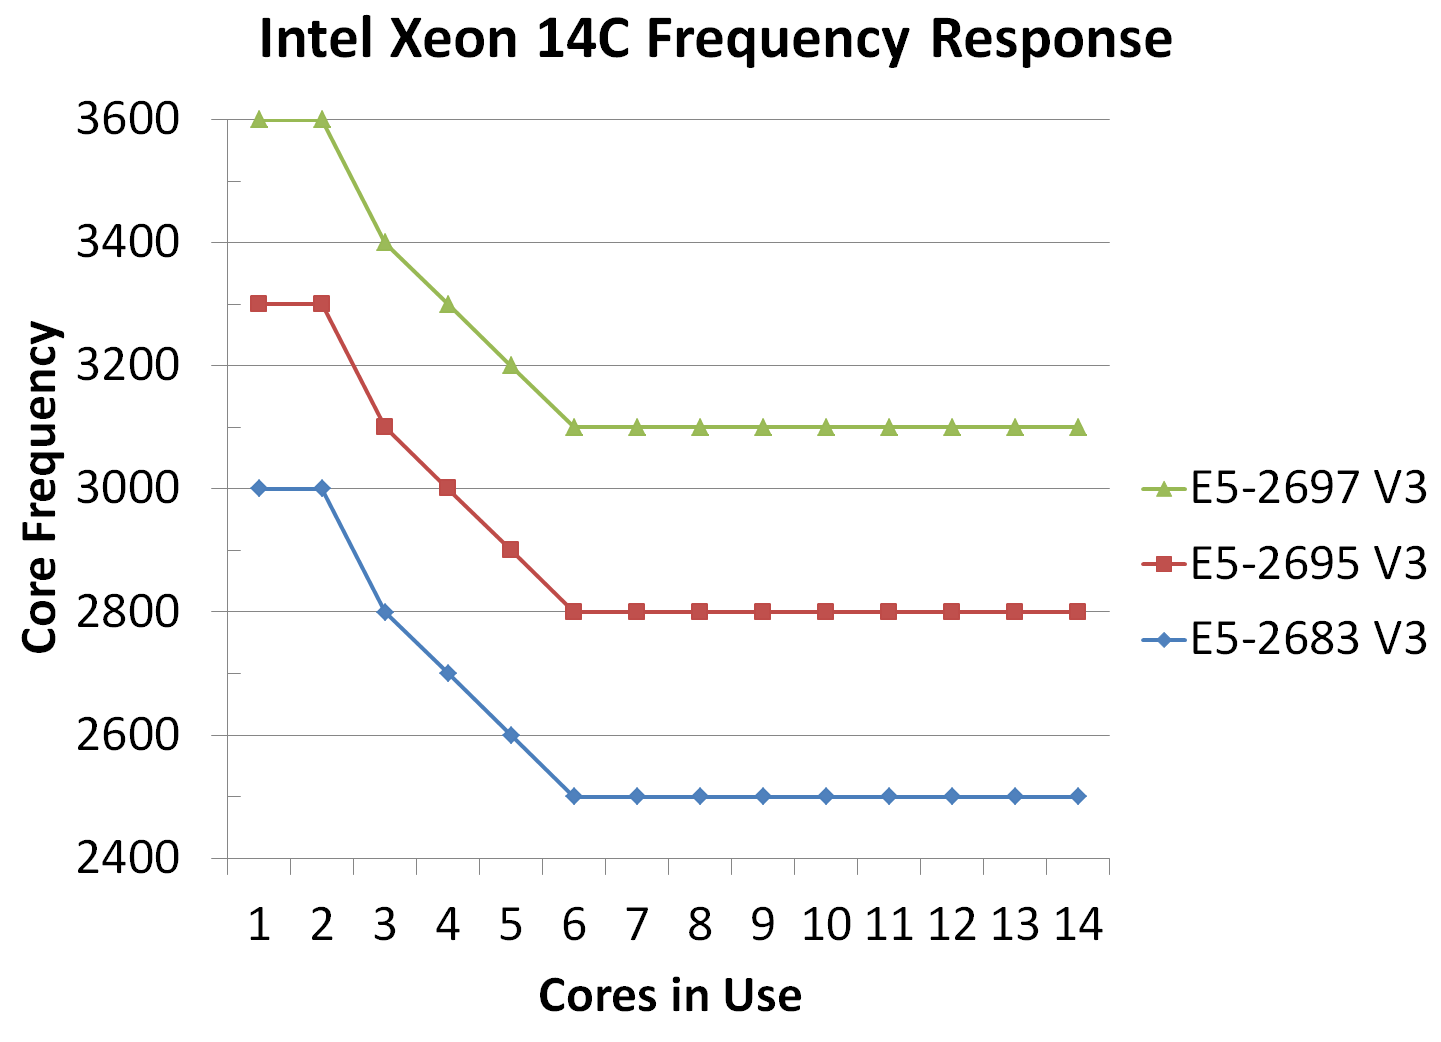
The big cores get a big power budget and a big price to match. The movement from the 2695 to the 2697 is only a few hundred MHz, but Intel charges and additional $278 for the privilege with a rise in 25 TDP. In terms of frequency response both of the CPUs follow the same path, marking an extra 300 MHz for the difference in power and price.
If we did some basic 24/365 100% use calculations, using the TDP and $0.10/kWh, The 2697 V3 would consume 1270 kWh and cost $127/yr compared to the 2695 V3 which would consume 1050 kWh and cost $105/yr. This is obviously not including any additional cooling needed, but the $22 difference in power per year against $278 in the CPU price difference would indicate 15 years of running to make up the difference. Clearly the cost per CPU matters more regarding how much work is going to be done per unit time. If the contract takes less time to complete, then it can sway the preference in terms of the faster CPU if the contract is CPU compute or response bound.
As this the third in our recent series of Xeon E5-2600 v3 performance coverage, we have covered most of the technical data in our previous two installments regarding 10 core and 12 core performance. We carry over the data from those tests, but refer back for details regarding chipset and DRAM information, as well as Johan’s extensive review covering in depth more of the server-focused aspects of the Xeon E5 v3 design.
Test Setup
As with the previous reviews, due to the timing available to test each of our CPU samples we were only able to get a limited range of E5-2695 V3 benchmark results. However, we were able to source two E5-2697 V3 CPUs for dual 14-core analysis leading to a 56-thread behemoth.
| Test Setup | |
| Processor | Intel Xeon E5-2695 V3 (120W), 14C/28T, 2.3 GHz (3.3 GHz Turbo) Intel Xeon E5-2697 V3 (145W), 14C/28T, 2.6 GHz (3.6 GHz Turbo) |
| Motherboards | ASUS X99-Deluxe ASRock X99 Extreme6 GIGABYTE MD60-SC0 |
| Cooling | Cooler Master Nepton 140XL Dynatron R14 |
| Power Supply | OCZ 1250W Gold ZX Series Corsair AX1200i Platinum PSU |
| Memory | ADATA XPG Z1 DDR4-2400 8x8 GB 1.2V Corsair DDR4-2133 C15 4x8 GB 1.2V G.Skill Ripjaws 4 DDR4-2133 C15 4x8 GB 1.2V |
| Memory Settings | JEDEC @ 2133 |
| Video Cards | AMD R7 240 DDR3 |
| Video Drivers | AMD Catalyst 13.11 |
| Hard Drive | OCZ Vertex 3 256GB |
| Optical Drive | LG GH22NS50 |
| Case | Open Test Bed |
| Operating System | Windows 7 64-bit SP1 |
Many thanks to...
We must thank the following companies for kindly providing hardware for our test bed:
Thank you to OCZ for providing us with PSUs and SSDs.
Thank you to G.Skill for providing us with memory.
Thank you to Corsair for providing us with an AX1200i PSU.
Thank you to MSI for providing us with the NVIDIA GTX 770 Lightning GPUs.
Thank you to Rosewill for providing us with PSUs and RK-9100 keyboards.
Thank you to ASRock for providing us with some IO testing kit.
Thank you to Cooler Master for providing us with Nepton 140XL CLCs.
Thank you to GIGABYTE Server for loaning us some CPUs and Dynatron CPU coolers.
Load Delta Power Consumption
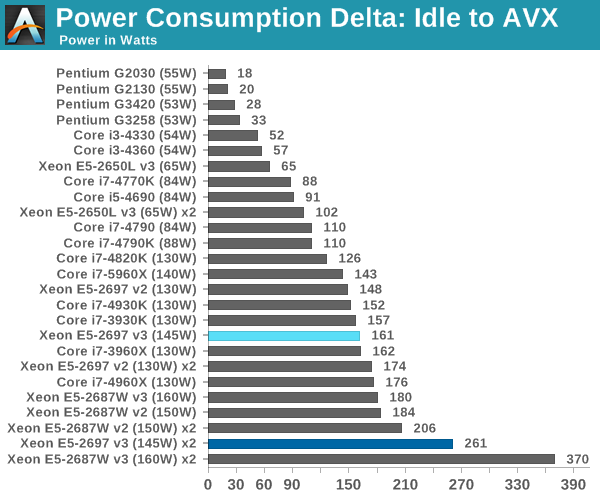
Power consumption was tested on the system while in a single MSI GTX 770 Lightning GPU configuration with a wall meter connected to the OCZ 1250W power supply. This power supply is Gold rated, and as I am in the UK on a 230-240 V supply, leads to ~75% efficiency > 50W, and 90%+ efficiency at 250W, suitable for both idle and multi-GPU loading. This method of power reading allows us to compare the power management of the UEFI and the board to supply components with power under load, and includes typical PSU losses due to efficiency.
We take the power delta difference between idle and load as our tested value, giving an indication of the power increase from the CPU when placed under stress.


44 Comments
View All Comments
bill.rookard - Thursday, November 20, 2014 - link
I don't think I'd want one. If you notice, a majority of the benchmarks which a normal person might find useful the i7-4790K came in highest and flat out won 12 of those benchmark tests. And of course it costs about 1/10th the price.MrSpadge - Thursday, November 20, 2014 - link
Since he's reading AT I don't think he's a normal "person" ;)dgingeri - Thursday, November 20, 2014 - link
you're right about that. I'm a systems admin in a test lab. I'd want it for my VM practice system. A Core i7 3930k isn't quite as nice to run a dozen VMs as I had hoped.cjcoats - Thursday, November 20, 2014 - link
About those Linux benchmarks:1) That "NPB, Fluid Dynamics" reports millions of operations _per thread_, which is deceptive as regards actual delivered "in your face" work performed per wall-clock time; the existing chart should be supplemented by one giving [ops per thread per sec]*[number of threads] -- i.e., total ops per sec, which is what I really care about.
2) For Linux benchmarks in general: what compiler and compile-flags? ...and is this "one binary for all the machines"? The performance can be greatly influenced by targeting the actual processor architecture ("-xHost" for Intel compilers, "-march=native -mtune=native" for Gnu. For the codes I use and the (SandyBridge or later) servers I use, targeting the architecture I'm running on typically may give as much as a 70% boost, which is nothing to sneer at when my run-times are measured in hours or even days.
mapesdhs - Friday, November 21, 2014 - link
Re your 2nd point, that's certainly true for th C-ray test. One can do all sorts of optimisationsto show huge performance gains which are not remotely realistic. Wouldn't surprise me if this
affects the other tests too.
Ian.
FriendlyUser - Thursday, November 20, 2014 - link
Will it play Assassin's Creed: Unity?anubis44 - Thursday, November 20, 2014 - link
You forgot to say: "BUT can it run (insert terribly optimized pig-of-a-game here) ?"Cravenmor - Thursday, November 20, 2014 - link
Enjoying my coffee...Laststop311 - Thursday, November 20, 2014 - link
These xeons are just crazy priced. I would be happy with an i7-5960k clocked at 4.2ghz to match my i7-980x clocked at 4.2ghz. But really even after 4 years the performance increase still does not justify spending close to 2000 on cpu + x99 mobo + 4x8GB ddr4. Since broadwell is just a tick broadwell-e probably wont justify the expense either so maybe after 6 years have passed with gulftown skylake-e will finally make the expense worth it. Even if not the extra features like pci-e connected storage, ddr4 and pci-e 4.0 will finally make it worth it. By then the ridiculous ddr4 ram prices should be in line with how ddr3 is priced now too.wallysb01 - Thursday, November 20, 2014 - link
You must not be doing much heavily threaded work then, because for those that are the total system performance delivered with say, a $7K workstation, has gone through the roof compared to westmere.For example, the X5660 was 6 cores at 2.8GHz and the E5-2650v3 is 10 cores at 2.3GHz, but actually operates at 2.5GHz (something westmere didn’t do with the difference in turbo binning), both for a little over $1000 bucks each. Then, if we add 5% performance per generation, that brings the 2.5GHz to 2.9 “westmere equivalent” GHz. Then the 10 core vs 6 core means the E5-2650v3 is giving you 70% more performance than the X5660 did.