The Toshiba TR200 3D NAND SSD Review: One Step Forward, One Step Back
by Billy Tallis on October 11, 2017 7:00 AM ESTRandom Read Performance
Our first test of random read performance uses very short bursts of operations issued one at a time with no queuing. The drives are given enough idle time between bursts to yield an overall duty cycle of 20%, so thermal throttling is impossible. Each burst consists of a total of 32MB of 4kB random reads, from a 16GB span of the disk. The total data read is 1GB.
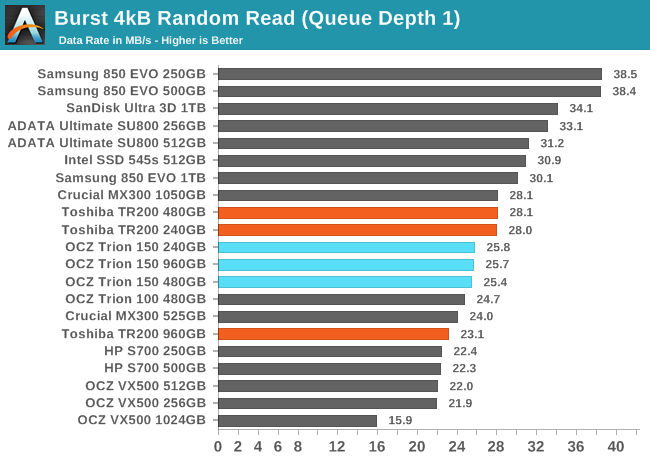
The QD1 burst random read speeds of the Toshiba TR200 are mostly normal for a budget SSD, though the 960GB model is notably slower than the smaller capacities that are using the 256Gb NAND dies instead of the 512Gb dies.
Our sustained random read performance is similar to the random read test from our 2015 test suite: queue depths from 1 to 32 are tested, and the average performance and power efficiency across QD1, QD2 and QD4 are reported as the primary scores. Each queue depth is tested for one minute or 32GB of data transferred, whichever is shorter. After each queue depth is tested, the drive is given up to one minute to cool off so that the higher queue depths are unlikely to be affected by accumulated heat build-up. The individual read operations are again 4kB, and cover a 64GB span of the drive.
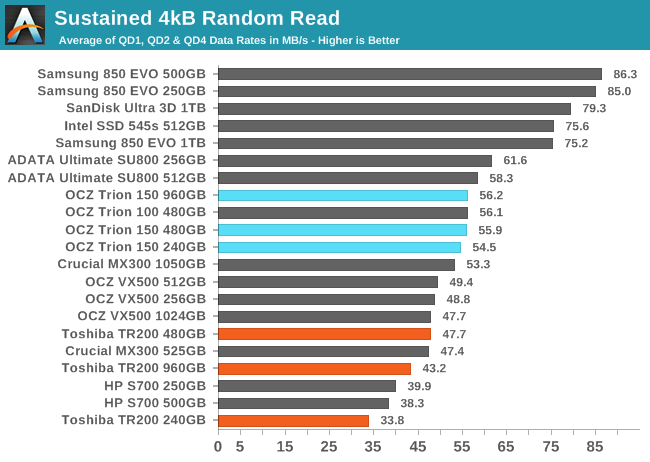
On the longer test that includes higher queue depths, the Toshiba TR200 falls to near the bottom of the chart. The 240GB and 960GB models are substantially slower than anything else we've tested of similar capacity. On the other hand, the 480GB TR200 is tied with the 525GB Crucial MX300, and the trend suggests that the 275GB Crucial MX300 would score a bit worse.
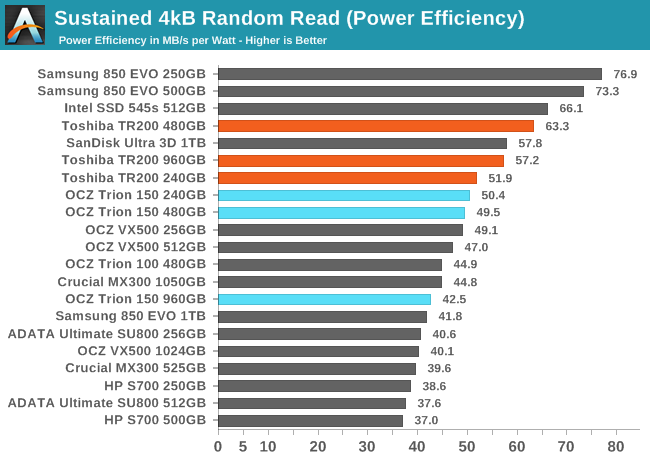
The power efficiency of the Toshiba TR200 during random reads is good, and a clear improvement over the TR150. Notably, the 960GB TR200 scores about the same as the SanDisk Ultra 3D 1TB, showing that the latter's higher performance is in proportion to the power cost of its DRAM.
 |
|||||||||
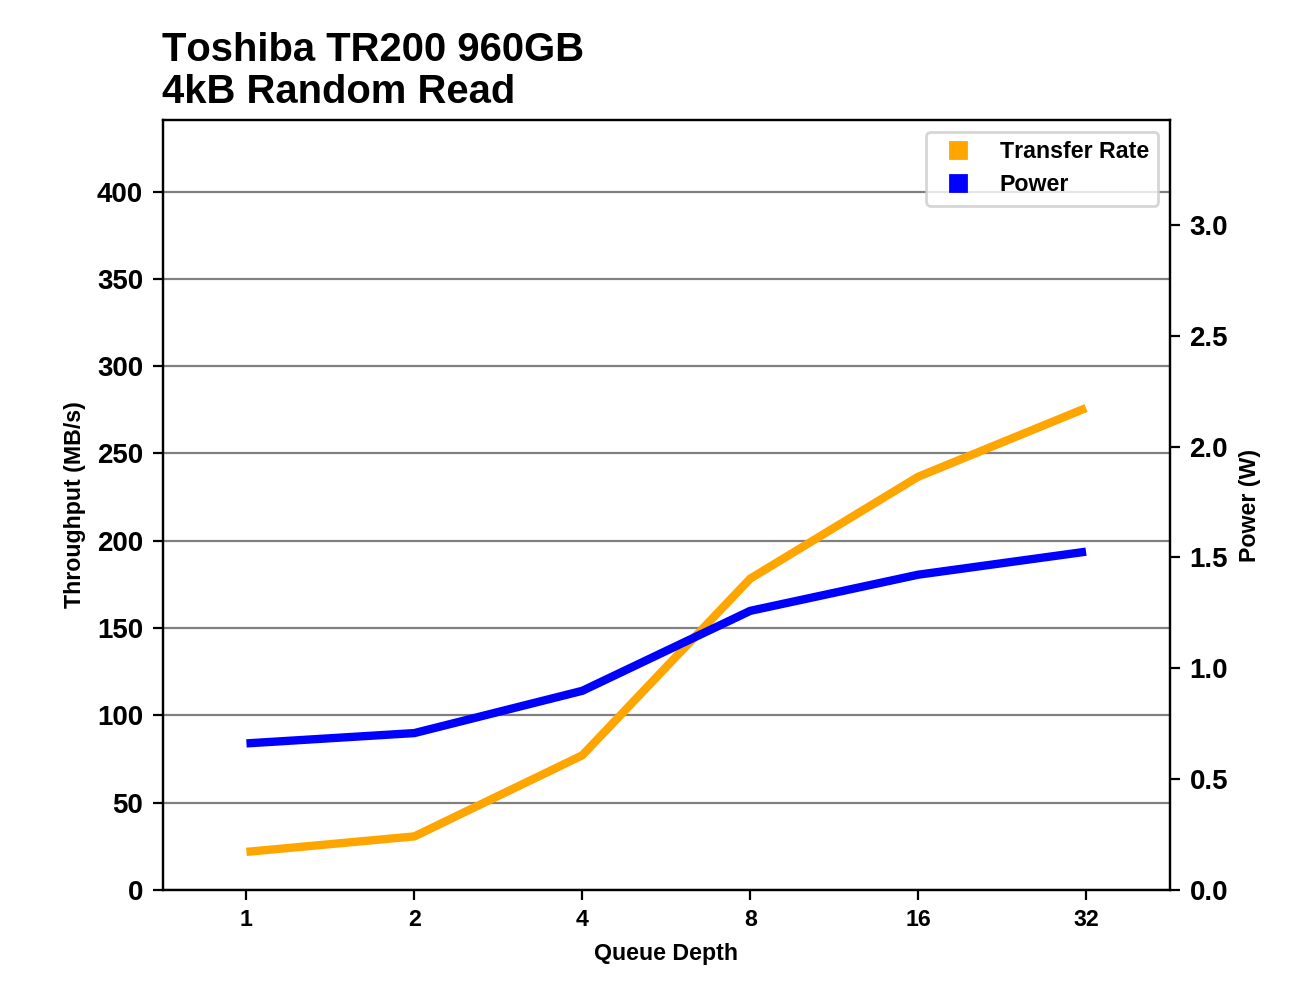
The TR200s all show very little random read performance increase from QD1 to QD2, and this is most of why their performance scores above are so low. Through the mid range of queue depths, the TR200 shows better scaling than many other budget SSDs, but at the high end the performance increases taper off. The 960GB model never provides substantially higher performance than the 480GB model, as both have the same number of NAND dies.
Random Write Performance
Our test of random write burst performance is structured similarly to the random read burst test, but each burst is only 4MB and the total test length is 128MB. The 4kB random write operations are distributed over a 16GB span of the drive, and the operations are issued one at a time with no queuing.
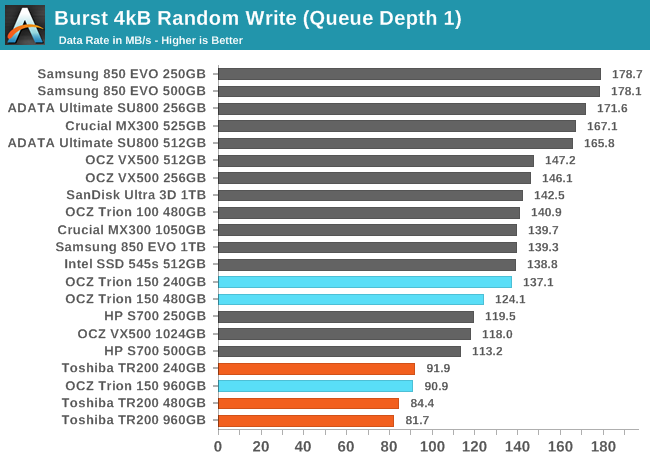
The Toshiba TR200s are the slowest drives for short bursts of random writes at QD1. The larger drives are slower, a pattern that the TR150 and several other models exhibit.
As with the sustained random read test, our sustained 4kB random write test runs for up to one minute or 32GB per queue depth, covering a 64GB span of the drive and giving the drive up to 1 minute of idle time between queue depths to allow for write caches to be flushed and for the drive to cool down.
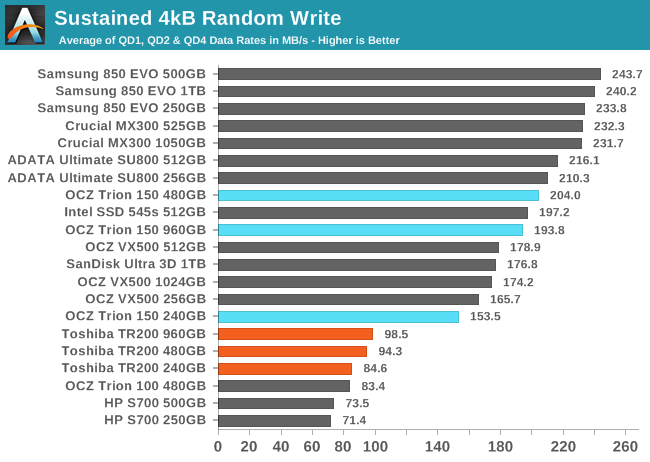
On the longer test of random writes involving some higher queue depths, the gap between the TR200 and a typical mainstream SATA SSD widens to a factor of two or more, but the TR200 also ends up ahead of the HP S700 and the original Trion 100.
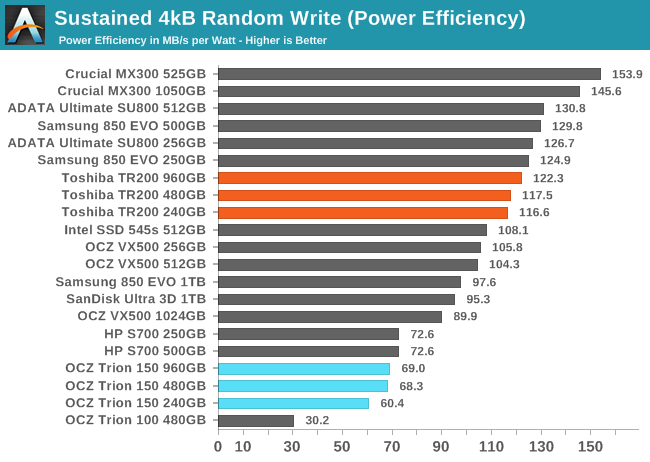
In spite of the poor sustained random write performance, the Toshiba TR200 shows above average power efficiency. This is a huge change relative to previous Trion/TR series drives, which were the least efficient drives on this test. The HP S700 also showed very poor efficiency during random writes.
 |
|||||||||
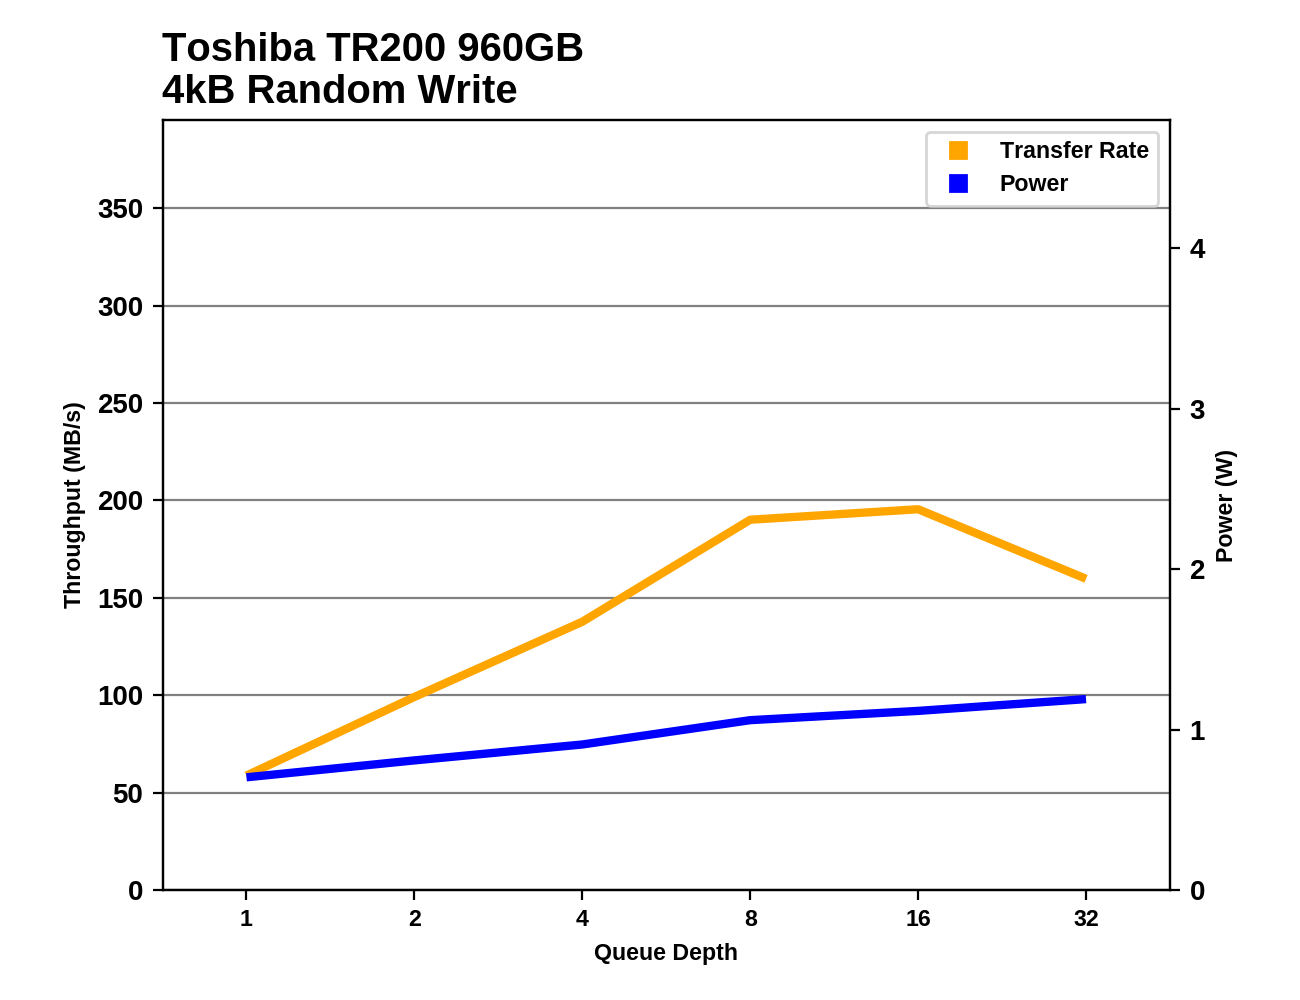
The 960GB TR200 shows steady performance scaling as queue depths increase, but by the end of the test its SLC cache has filled up and performance begins to drop. The smaller TR200s also saturate by around QD8 and hold steady at very low performance levels. Power also stays low even at higher QDs, with the 240GB model never exceeding 1W.


50 Comments
View All Comments
theniller - Wednesday, October 11, 2017 - link
Why is this shit still a thing? The process node is there the stacking is there. Where is my 500 GB slc drive?lilmoe - Thursday, October 12, 2017 - link
IKRI already pay double for my drives work 50% over provisioning. SLC would cost me the same yet dramatically improve QD1 performance and endurance.
And they say there's no market for that. BS.
cekim - Wednesday, October 11, 2017 - link
Engineering you might expect from a company going out of business during the biggest supply shortage we've seen in PC parts in quite some time. Why god why?Billy Tallis - Thursday, October 12, 2017 - link
Toshiba's NAND division isn't going out of business; it's thriving. The nuclear power part of Toshiba is just failing so hard that Toshiba as a whole is deeply in the red.mapesdhs - Wednesday, October 11, 2017 - link
Way slower and more expensive than an 850 EVO was 2 years ago. *yawn* This race to the bottom re performance/endurance is annoying.I wish the charts would include a couple of older models so so we can really see whether this tech has actually moved on or not, eg. an 840 Pro (wonderful MLC), Vector, Vertex4, Neutron GTX - all of these were already being bottlenecked by the SATA3 limit when the 840 Pro was reviewed on AT 5 years ago. Are these Toshiba models any better than what Samsung/OCZ was back then? The last time I saw it included, the Vector inparticular still looked pretty good. As long as this lack of performance/endurance continues, I just keep hunting for lightly used 840 Pros, etc. Bagged another 256GB recently for 51 UKP.
I miss the days when the 850 EVO 250GB was 53 UKP, everything has become so expensive since then, and not just SSDs. Prices of most RAM types has doubled.
Billy Tallis - Wednesday, October 11, 2017 - link
I've tested almost all of the older SSDs that I have on hand. Some of the older ones have died, or been transferred to other AT editors for use as boot drives. There are a few old drives I have in active use on various systems that I can clone then run through the test suite (a SandForce drive, a Crucial MX100, a Samsung 840 Pro) when time permits. Fortunately, my testing backlog is almost gone, so I may be able to get some of those drives added to the Bench database later this month.mapesdhs - Friday, October 13, 2017 - link
That would be great Billy, thanks!! 8)Btw, have you seen the article on techreport where they tested a bunch of SSDs to death? The 840 Pro was the final one to go, after it had written an astonishing 2.4PB. IIRC I can't link to other sites directly here, so just search for, "The SSD Endurance Experiment: They're all dead", the piece is written by Geoff Gasior.
artifex - Thursday, October 19, 2017 - link
I know an anecdote is not data, but my Samsung 830, 128GB is still going after about 5 years. Magician says it's pushed 20TB. It's actually still my gaming OS drive, too.Question, though: how come I hear nothing about the 750s, now? Did that line get dropped quickly? I got one in a sale last year, and I hope they're not terrible.
yifu - Monday, November 20, 2017 - link
is this the most power efficient SSD in the market today? I have missed the BX100, Now I can not find it anymore.