The Intel SSD 600p (512GB) Review
by Billy Tallis on November 22, 2016 10:30 AM ESTSequential Read Performance
The sequential read test requests 128kB blocks and tests queue depths ranging from 1 to 32. The queue depth is doubled every three minutes, for a total test duration of 18 minutes. The test spans the entire drive, and the drive is filled before the test begins. The primary score we report is an average of performances at queue depths 1, 2 and 4, as client usage typically consists mostly of low queue depth operations.
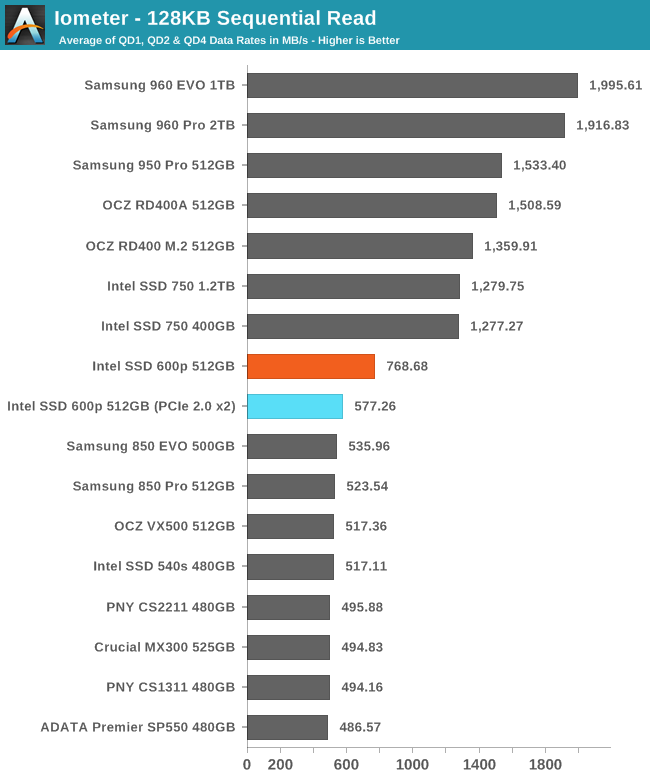
Even when limited to PCIe 2.0 x2 the 600p has slightly higher sequential read speed than SATA drives can manage, but when given more PCIe bandwidth the 600p doesn't catch up to the more expensive NVMe drives.
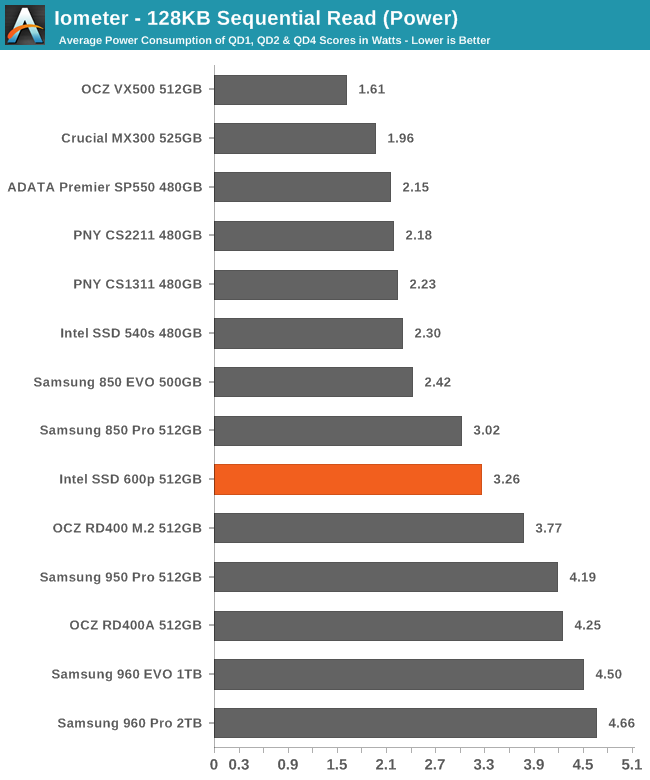
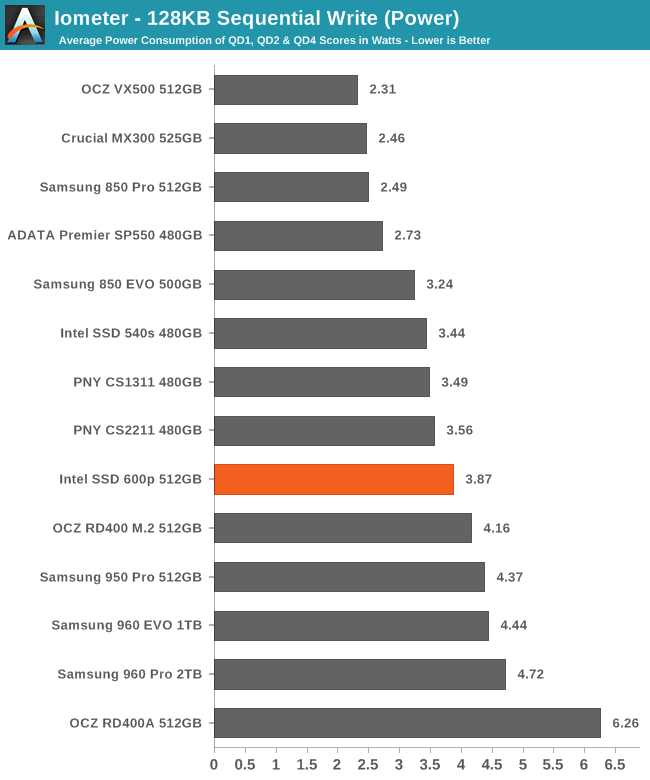
The 600p actually manages to surpass the power efficiency of several SATA SSDs, but it can't compete with the other NVMe drives that deliver twice the data rate.
 |
|||||||||
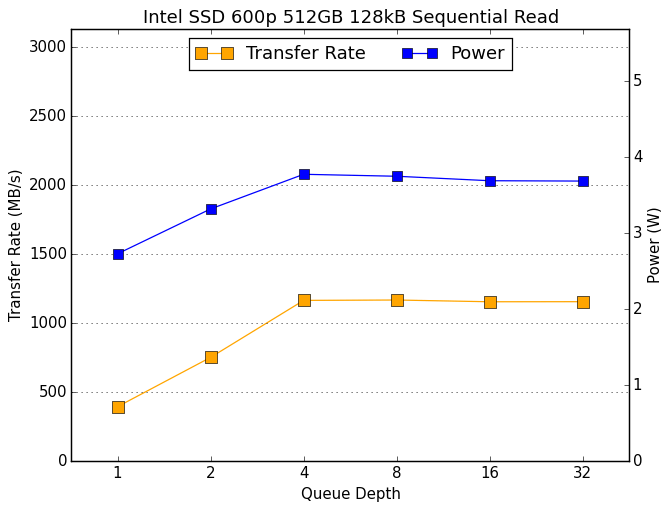
The 600p starts at just under 400MB/s hits its read speed limit at QD4 with around 1150MB/s. The other PCIe SSDs perform at least that well at QD1 and go up from there.
Sequential Write Performance
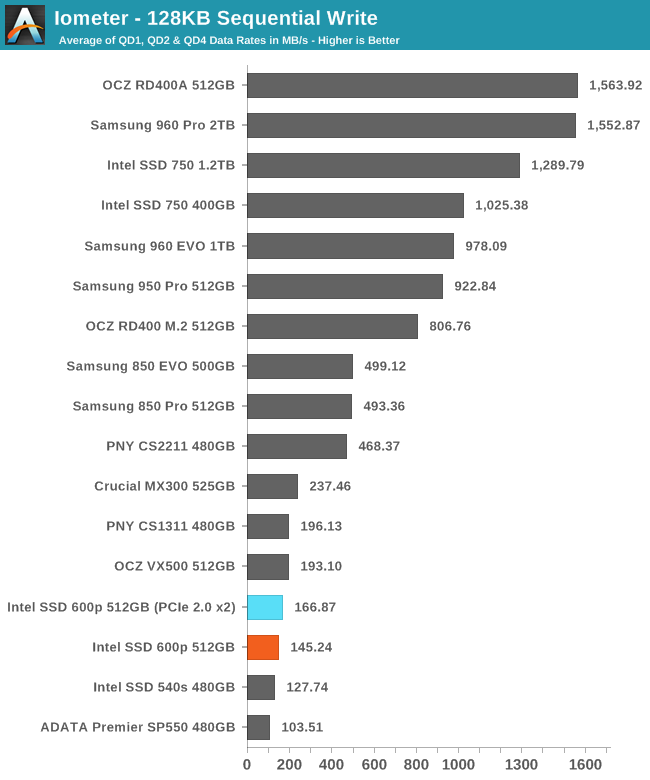
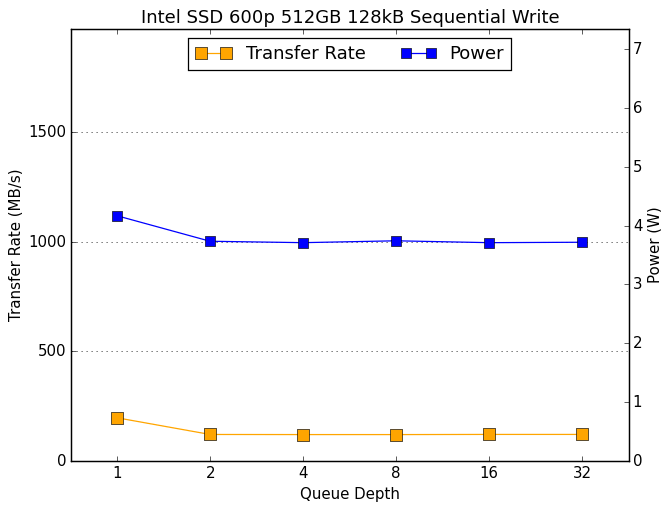
The sequential write test writes 128kB blocks and tests queue depths ranging from 1 to 32. The queue depth is doubled every three minutes, for a total test duration of 18 minutes. The test spans the entire drive, and the drive is filled before the test begins. The primary score we report is an average of performances at queue depths 1, 2 and 4, as client usage typically consists mostly of low queue depth operations.
It is a surprise to see the Intel 600p performing better in the motherboard's M.2 slot than in the PCIe 3.0 adapter, but in both cases the sustained write speeds are so slow that the interface is not a limitation.
The power consumption of the 600p when it's in the PCIe 3.0 adapter is high enough that temperature may be a factor in this test, and the 600p may have performed better in the motherboard's M.2 slot simply due to better positioning and orientation in the case.
 |
|||||||||
It is a familiar pattern for PCIe SSDs to see the highest write speeds at the beginning of the test, and a completely flat graph thereafter as thermal limits kick in. We're just used to seeing the performance curve near the top of the graph instead of at the bottom.
 |
|||||||||
| PCIe 3.0 x4 adapter | motherboard M.2 PCIe 2.0 x2 | ||||||||
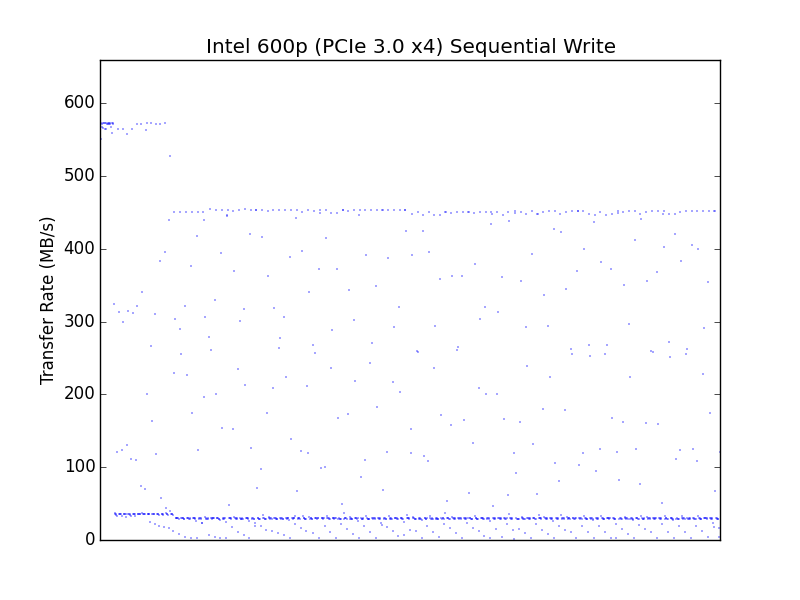
A comparison of the second by second performance during the sequential write test shows that the 600p reaches a steady state with the same kind of inconsistency we saw for random writes, and in the PCIe 3.0 adapter the performance is reduced across the board and the worst drops in performance are much closer to zero.


63 Comments
View All Comments
ramvalleru - Tuesday, December 6, 2016 - link
What advantages does Intel 600p has over Samsung 850 Evo with its 4 x pci-e. Less bottleneck with multi application writes and reads?KAlmquist - Friday, December 9, 2016 - link
If you mean compared to the 960 EVO, the 600p is less expensive. Also, with the 600p you are getting the Intel brand name and quality control, backed up with a 5 year warranty vs. a 3 year warranty on the 960 EVO.RetsamCP - Saturday, December 24, 2016 - link
I may just be a little confused but how did the 960 Pro 2TB bench and average service time latency of 160.9 ms in the Destroyer bench but score 0 for percentage of service times >100 ms?There had to be service times over 100 ms for the average to be over 100 ms, but how was the average affected so much when service times >100 ms made up <0.01% of the total benchmark?
What am I missing?